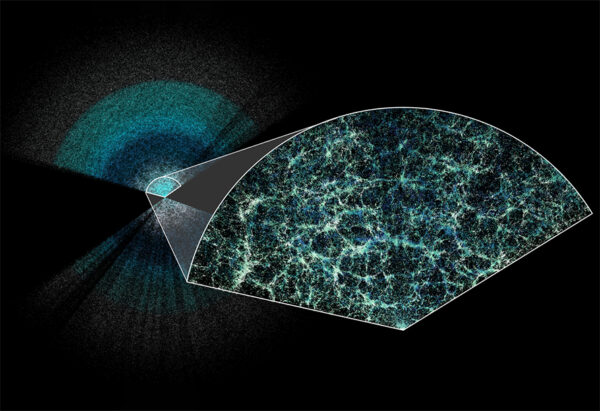
In its quest to study the effect of dark energy on the expansion history of the Universe, DESI has been charting the cosmos, creating the largest 3D map of the Universe ever made — a map that stretches back over 11 billion years of cosmic time.
In a press announcement today, the project made its initial report on the cosmological clues recorded in the map. The results make use of data from the first year of the DESI survey, which will be carried out over a total of five years.
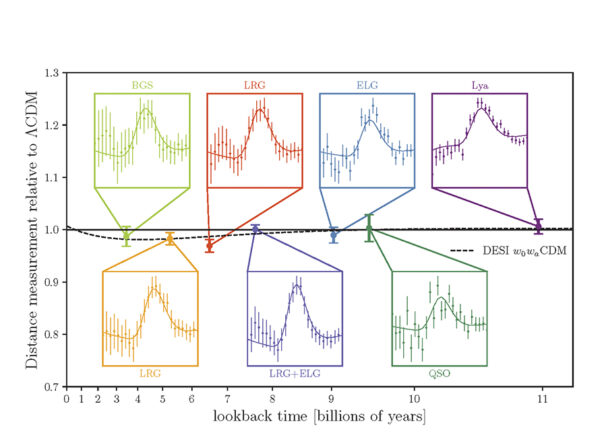
DESI’s 3D map tracks the frozen-in imprint of baryon acoustic oscillations (BAO), as recorded two ways: in the spatial distributions of galaxies, and in the structure of intergalactic gas seen along the line of sight to distant quasars (the Lyman alpha forest). Using these data, DESI scientists have measured the BAO signal at 7 epochs (i.e., slices of cosmic time) from 3 billion to 11 billion years ago. Because the measured BAO signal is a so-called “standard ruler”, the scientists can infer how the Universe expanded over its history.
The results are amazingly precise. Because of DESI’s high efficiency and stability, combined with its ability to measure spectra for large numbers of galaxies and quasars, the Universe’s expansion history is now known to better than 1% precision, yielding the best picture yet of how the universe has evolved.
The results are in general agreement with the current best cosmological model (Lambda CDM), which takes into account the roles of dark energy and dark matter. But as noted by DESI Director Michael Levi, “we’re also seeing some potentially interesting differences that could indicate that dark energy is evolving over time. Those may or may not go away with more data, so we’re excited to start analyzing our three-year dataset soon.”
With 4 more years of DESI data to come, stay tuned to see how the story evolves as DESI’s map reaches completion!

These results were reported in multiple papers posted on arXiv and in talks presented today at the American Physical Society meeting. A guide to the suite of papers presenting these results is available at the DESI blog.