
RubinObs/NOIRLab/SLAC/NSF/DOE/AURA/P. Horálek (Institute of Physics in Opava) and DESI Collaboration/DOE/KPNO/NOIRLab/NSF/AURA/M. Sargent (Berkeley Lab)
Follow up of Rubin Alerts Characterizes the Transient Sky
4 May 2026
Joan Najita (NOIRLab)
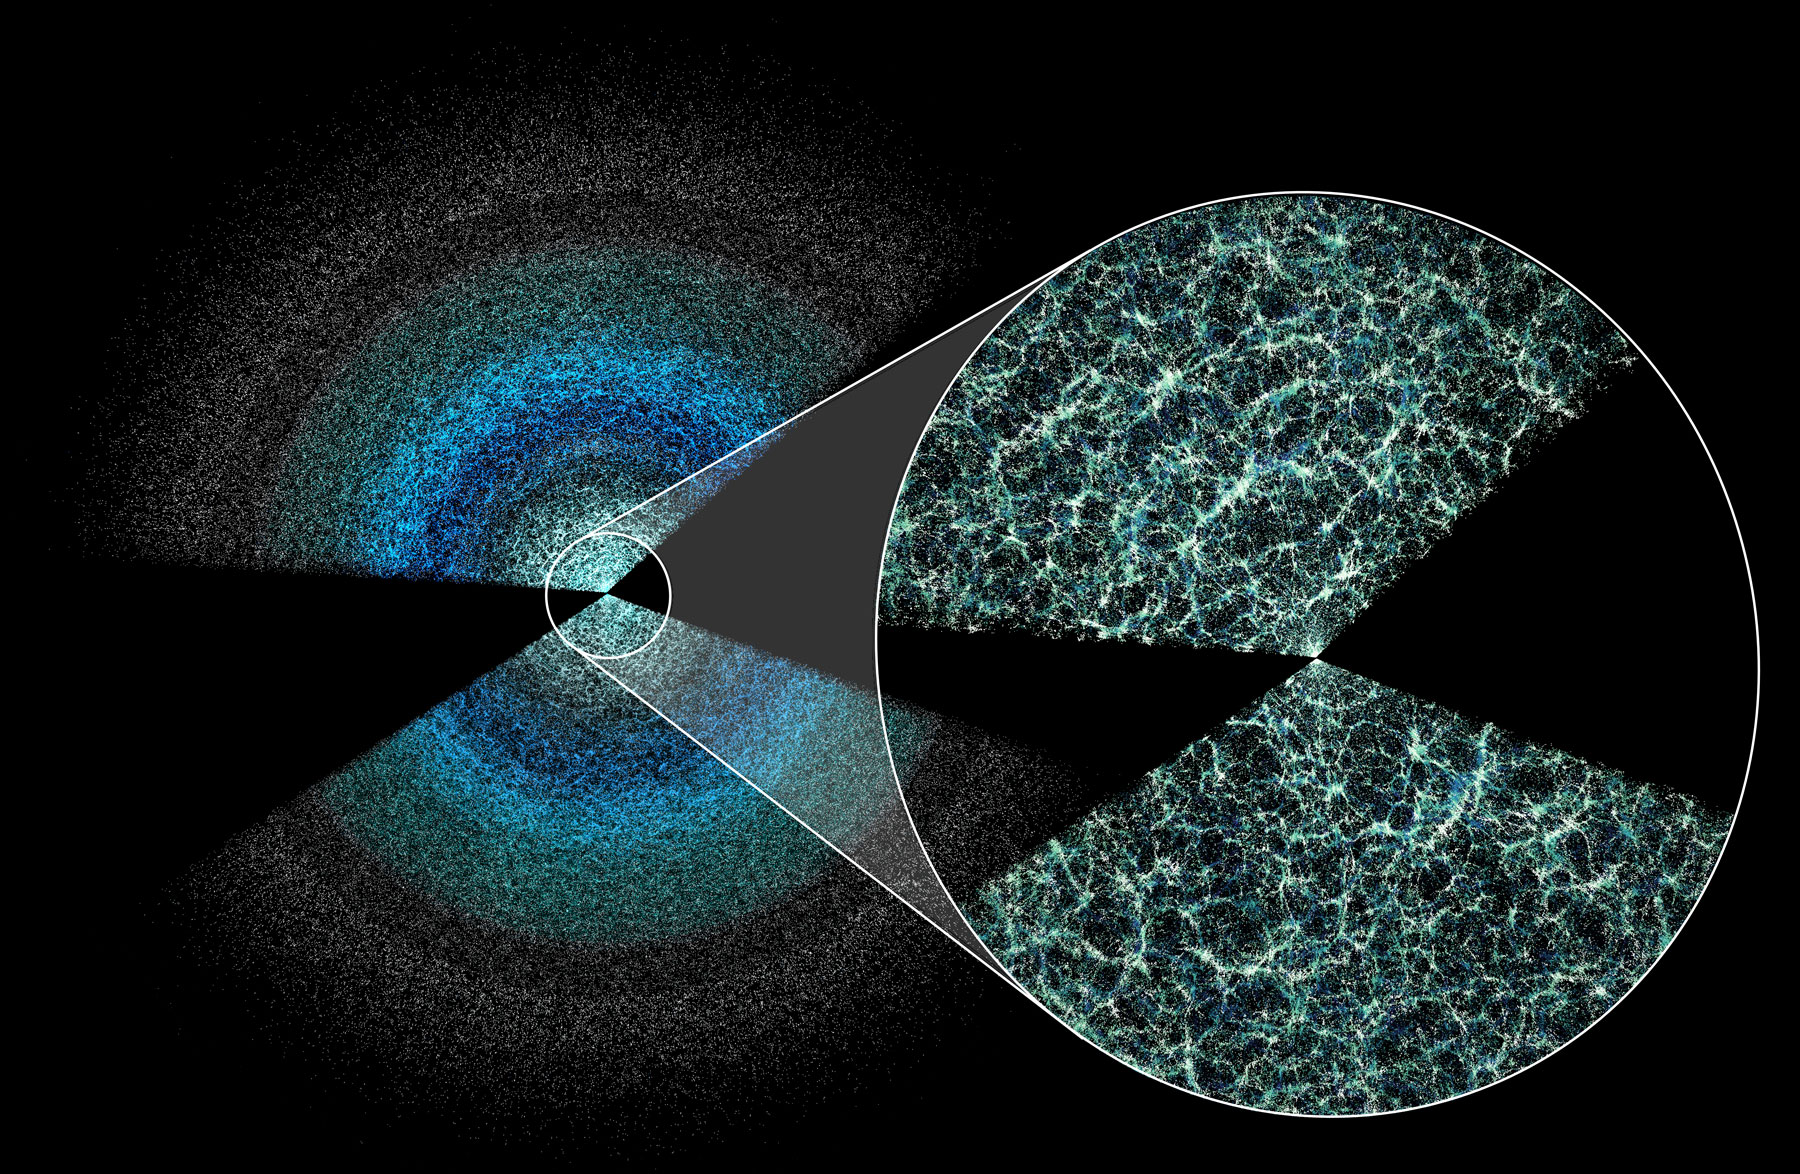
With its large field of view and ability to acquire a lot of spectra simultaneously, DESI is well suited to many investigations beyond its primary mission of charting out the role of dark energy in the expansion history of the Universe. One example is its ability to characterize phenomena discovered by today’s large time domain facilities such as the Vera C. Rubin Observatory. In a major development, Rubin Observatory recently issued its first “alerts,” announcements that report changes in the night sky. Each alert documents a new source of light, a source that brightened or dimmed, or an object that moved, with 800,000 alerts issued the night of 24 February. The Rubin Observatory’s Legacy Survey of Space and Time (LSST), set to begin later this year, will scan the Southern sky for ten years and is expected to generate up to seven million alerts each night. Understanding the nature of these events often relies on spectroscopy, and a highly multiplexed spectroscopic system like DESI, with its large field of view, is a good match to the large volume of alerts.
To learn what DESI is up to in this area, we sat down with Xander Hall, a graduate student at Carnegie Mellon University who is working with Antonella Palmese. They use DESI to study extragalactic transients, i.e., objects or events that rapidly change their brightness.
Q: Can you tell us about DESI’s Rubin Transients project and what it aims to do?
Xander: The DESI Rubin Transients project is a special part of the broader DESI Transients Survey we have been running. We originally proposed to carry out the Transients Survey through DESI’s call for proposals to use its “spare fibers”, fibers that can’t be matched to target from the main DESI program on a given pointing. We started the Survey with transients discovered by other telescopes — ATLAS (the Asteroid Terrestrial-impact Last Alert System robotic survey network in Hawaii) and ZTF (the Zwicky Transient Facility, a high-cadence survey in California) — observing them with spare fibers as DESI targets of opportunity. This allows us to spectroscopically classify a large number of transients. We have taken spectra of about 1000 transients this way.
Now that Rubin is issuing alerts, we’ve started the DESI-Rubin part of the project, where we are pointing DESI specifically at transients from the Rubin Deep Drilling fields (DDF). The DDFs are regions of the sky that Rubin’s LSST is studying intensively in the first few years of the survey. Somewhat perfectly, DESI and Rubin have very similar fields of view. As a result, DESI can almost entirely cover a Rubin DDF, such as the COSMOS field, in one pointing.
Q: How do you identify your targets? And how do you schedule them for DESI observations?
Xander: We identify targets through the Babamul broker, one of the services that is processing the LSST stream of alerts. We apply custom filters and use various machine learning scores and star/galaxy catalogs to filter out variable stars, since we’re not interested in those. Our goal is basically to select every extragalactic transient within the Rubin field and put a DESI fiber on it. We’ve been able to target as many as 300 transients in a single DESI pointing.
Q: How long does it take to receive the reduced spectra? And what happens next?
Xander: In theory, we can get reduced spectra throughout the night, but in practice we get them the next day. To classify the transient, we run the Next Generation Superfit (NGSF) software on the spectrum. NGSF can identify supernovae of all major types based on their spectra. We find that most of the transients are AGN but each pointing has a few supernovae.
Q: How do you share your results with the world?
Xander: Currently we publish our supernova classifications and spectra to the Transient Name Service (TNS). There are tentative plans to make all the transient spectra public.
Q: What have you found so far?
Xander: We’ve followed up 400 Rubin transients to date and found about 10 supernovae. So far, they are all classical supernovae. One advantage we have with DESI is that due to the quantum efficiency of the instrument and the 4m telescope aperture, we can study targets as faint as those accessible to 8-10m facilities. As LSST begins full-time observations, we hope to spectroscopically probe higher redshift transients.
Q: I read that your team made the first public report of a spectroscopic classification of a Rubin-discovered transient. That sounds like an achievement!
Xander: As far as I can tell we were the first to publicly classify a Rubin transient with public data! Being first is cool and demonstrates the ability of our survey operations team to make this happen. But I think the more interesting thing will be the long-term spectral sequence of various supernovae and hopefully TDEs (tidal disruption events) we will obtain. We are hoping to hit the COSMOS field every 2-3 weeks. This will give us a very nice spectroscopic sequence that normally would be impossible to achieve in a reasonable time with a traditional single-object slit-based instrument. DESI also offers much higher spectral resolution than instruments traditionally used for supernova follow-up. We traditionally obtain spectra with a spectral resolving power of only R = 100–1000, so DESI’s R = 5000 resolution opens up the possibility of finding new narrow-line features. That’s exciting because, for example, infant supernovae can have young CSM (circumstellar medium) interaction lines that are only visible with a high-resolution spectrograph.
Q: How did you become engaged in this endeavor?
Xander: I’ve been doing extragalactic transient science since high school. In high school, I mainly did variable stars, some machine learning classification of stars versus galaxies, and worked on Zooniverse projects. When I started my PhD at CMU last year, I joined DESI and started leading the spare fiber program. As part of that effort, I’ve worked on selecting targets, classifying them, eventually leading to a population analysis, which we wrote about here. Now, that effort has expanded to also include this DESI-Rubin project.
Q: How long will you keep this up? And what do you hope will happen?
Xander: So far, our plans are to keep going until the end of the DESI-I survey. We’ve been working to incorporate transient follow-up more broadly into the goals of the follow-on DESI-II survey, including more dedicated plans to catch more Type Ia supernovae, which are a critical rung on the distance ladder. My personal interest is in Tidal Disruption Events (TDEs) and probing them to higher redshifts. I’m hoping we can identify a couple of bright high-z TDEs within these deep drilling fields and then take an excellent DESI spectral sequence.


 9 March 2026


 A graduate student at the Harvard-Smithsonian Center for Astrophysics, Claire Lamman studies the orientations and alignments of galaxies and what they can tell us about cosmology and the cosmic web. She is also a talented artist and the recipient of a National Academies of Sciences
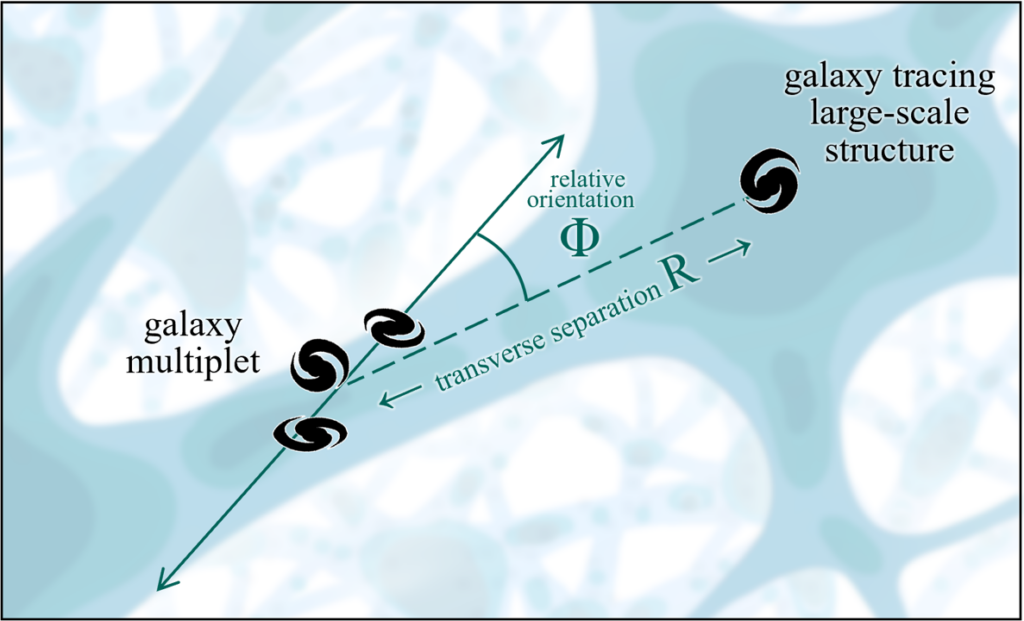

