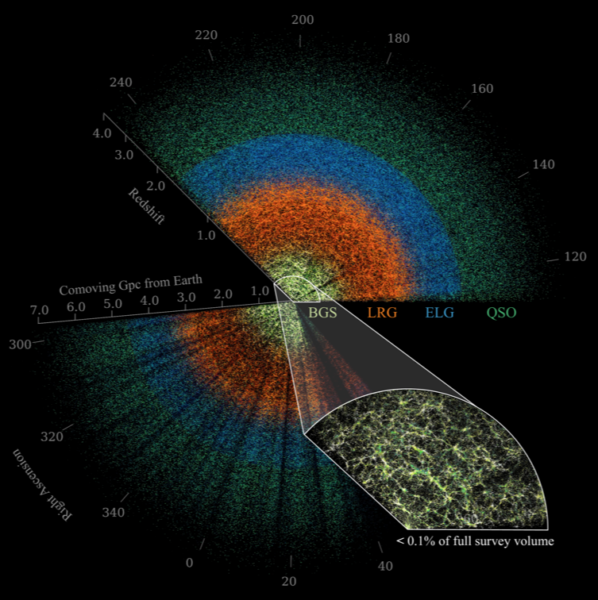
• Skip to main content
  • Skip to primary sidebar
  • Skip to footer

Dark Energy Spectroscopic Instrument (DESI)

  • / science /
    • science overview
    • cosmology and dark energy
    • redshifts and distance
    • mapping the universe
    • the DESI science mission
    • the DESI survey
    • imaging surveys
  • / instrument /
    • instrument overview
    • telescope
      • tohono o’odham
    • corrector
    • focal plane system
    • fiber system
    • spectrograph
    • instrument control system
    • data systems
    • bringing DESI to life
      • commissioning Instrument
      • protoDESI
  • / collaboration /
    • DESI team
    • DESI builders
    • collaborating institutions
    • sponsors
    • code of conduct
    • vendors
    • collaboration policies
  • / press /
    • announcements
    • in the news
    • press releases
    • tweets by desisurvey
    • blog
    • acknowledgments
  • / galleries /
    • videos
    • image gallery
  • / for scientists /
    • data releases
    • instrument design
    • imaging data
    • target selection and survey validation
    • theory and simulations
    • other DESI science
    • key publications
    • all DESI papers
    • team login
    • request a DESI speaker
    • internal
  • / education & outreach /
    • meet a DESI member
    • blog
    • planetarium show
    • DESI high
    • interactive visualizations
    • DESI Merch

DESI DR2 Results: March 19 Guide

March 19, 2025 by Wynne Turner

Wynne Turner

On March 19, DESI released a set of papers providing the measurements and interpretation of Baryon Acoustic Oscillations (BAO) based on Data Release 2 (DR2) – the first three years of survey data. This page contains a guide to the publications and main results. The papers are available here and on arXiv.

In addition to these new results, Data Release 1 (DR1) is now publicly available, with its corresponding paper summarized at the end of this guide. For summaries of the papers based on DR1 results, see our 2024 paper guides from April 4 and November 19.

One of many contours covered in the DR2 BAO cosmological analysis paper, showing the constraints on parameters of evolving dark energy. Credit: Cristhian Garcia-Quintero
An annotation of the above key figure for general audiences. The Universe grows, so the total density of matter goes down. But dark energy is different! This plot describes the “behavior” of dark energy – how its density changes as space expands. Credit: Claire Lamman

Helpful links

  • A press release containing a high-level overview of our main results: https://newscenter.lbl.gov/2025/03/19/new-desi-results-strengthen-hints-that-dark-energy-may-evolve/
  • A press release covering Data Release 1: https://newscenter.lbl.gov/2025/03/19/desi-opens-access-to-the-largest-3d-map-of-the-universe-yet/
  • DESI’s YouTube channel, including a playlist of videos covering the DR2 BAO results: https://www.youtube.com/@DESISurvey
  • A short video on our results for the general public: https://youtu.be/Td0jakzT-Lk
  • A list of key publications from DESI: https://data.desi.lbl.gov/doc/papers/
  • For more background on DESI’s science, see our public webpages.
  • DESI’s public data releases, now including DR1: https://data.desi.lbl.gov/doc/releases/

The DR2 results fall into seven main analysis categories as shown in the first figure below. The two on the left-hand side highlighted in green focus on galaxy and quasar clustering, as well as clustering of the Lyman-alpha forest, and include the BAO results released on March 19. Also highlighted in green is cosmological inference, which is based on measurements from both the Lyman-alpha forest and galaxy and quasar clustering. The bottom figure lists the papers released on March 19, featuring two key papers along with five supporting papers.

The seven categories for DESI DR2 analysis, with the three highlighted in green corresponding to results released on March 19. Credit: Gustavo Niz and Alejandro Aviles
The two key papers and several supporting papers released on March 19. Credit: Gustavo Niz and Alejandro Aviles

March 19 Paper Summaries

BAO Measurements from the Lyman-alpha Forest

Baryon Acoustic Oscillations (BAO) are a powerful standard ruler in cosmology, originating from ripples in the density of matter from the early universe. This ruler is used to constrain the universe’s expansion history by measuring the clustering of various tracers of the matter-density field. The most distant tracer used by DESI is the Lyman-alpha (Lyα) forest, a collection of absorption lines seen in the spectra of high-redshift quasars that map the distribution of neutral matter in the intergalactic medium. DESI’s DR2 results provide the most precise measurement of the BAO scale above redshift two.

DESI DR2 Results I: Baryon Acoustic Oscillations from the Lyman Alpha Forest

arXiv: 2503.14739

Summary: We have obtained the most precise measurement of the baryon acoustic oscillation scale above redshift two ever recorded, with a statistical precision of only 0.65 percent. The extremely high quality of this measurement when the universe was only about 3 billion years old is an important part of DESI’s new results on the history of cosmic expansion.

This plot shows the Lyman-alpha BAO measurement from DR2 with statistical-only uncertainties (red contour) and statistical+systematic uncertainties (solid indigo contour). The previous results from DESI DR1 are also shown (light-blue contour), as well as constraints inferred from Planck cosmic microwave background (CMB) data assuming ΛCDM (orange contour). Lastly, the combination of Planck CMB and DES Year 5 supernovae data assuming w0waCDM is shown (dotted black contour).

Validation of the DESI DR2 Lyα BAO analysis using synthetic datasets

Corresponding author: Laura Casas

arXiv: 2503.14741

Summary: The second data release (DR2) of the Dark Energy Spectroscopic Instrument (DESI), containing data from the first three years of observations, doubles the number of Lyman-α (Lyα) forest spectra in DR1 and it provides the largest dataset of its kind. To ensure a robust validation of the BAO analysis using Lyα forests, we have made significant updates to both the mocks and the analysis framework used in the validation, which we present in this paper. The figure presents the BAO measurement results from two sets of mocks: a stack of 100 Saclay mocks (previously used in DR1) and 300 CoLoRe-QL mocks (a new set of Gaussian Lyα mocks that incorporate a quasi-linear input power spectrum to model the non-linear broadening of the BAO peak). Our goal was to recover the true BAO parameters within one-third of the statistical uncertainty from DESI DR2 (represented by the black dotted line in the figure). The results indicate we are very close to meeting this criterion, and we discuss the small bias observed in Section 5 of the paper.

Construction of the Damped Lyα Absorber Catalog for DESI DR2 Lyα BAO

Corresponding author: Allyson Brodzeller

arXiv: 2503.14740

Summary: Damped Lyman-alpha absorption (DLA) systems are neutral hydrogen reservoirs with column densities N(HI)>2×1020 cm-2 observable in the Lyman-alpha forest of some quasars. The absorption profile of DLAs consist of broad damping wings that extend for thousands of km/s, compromising a significant fraction of the Lyman-alpha forest when present. It is therefore crucial to identify, catalog, and mask DLAs to mitigate their impact on Lyman-alpha forest clustering. This paper presents the DLA catalog strategy for the DR2 Lyα BAO measurement. The catalog is constructed using three DLA classification algorithms: the Gaussian process model from Ho et al. (2021), the CNN from Wang et al. (2022), and a spectral template DLA classifier which this work introduces. Our final DLA catalog for Lyman-alpha BAO is estimated to be 76% pure and 71% complete.

This plot shows the purity and completeness of the three DLA classifiers as a function of their respective confidence thresholds for detection. Stars indicate the choices for the Lyα BAO DLA catalog. See Figure 5 in the paper for more details.

BAO Measurements from Galaxies and Quasars & Cosmological Constraints

The rest of DESI’s BAO results come from using galaxies and quasars as tracers of large-scale structure. Cosmological constraints are then derived from the combination of these measurements with those from the Lyman-alpha forest (described above). This dataset – more than twice the size of DR1 – is the largest ever used to measure BAO. These new results provide the best measurements of the BAO scale to date, enabling precise constraints on dark energy.

DESI DR2 Results II: Measurements of Baryon Acoustic Oscillations and Cosmological Constraints

arXiv: 2503.14738

Summary: This paper presents the measurement of baryon acoustic oscillations in six different galaxy and quasar samples from the first three years of DESI observations, and explores the implications of these results for cosmology when combined with the CMB, supernovae and weak lensing. The evidence for a time-evolving dark energy equation of state has increased since the Year 1 results, which is very exciting! We’ve also performed a lot of extra tests this time which make us confident that the result isn’t driven by some unknown effect in any of the data.

This figure shows how DESI DR2 BAO measurements constrain the universe’s expansion history. Measurements from the seven tracer samples are shown as colored points with error bars. See Figure 1 in the paper for more details.
Constraints on the dark energy equation of state from fits of the w0waCDM model to DESI DR2 in combination with CMB alone and CMB with three supernovae datasets.

Validation of the DESI DR2 Measurements of Baryon Acoustic Oscillations from Galaxies and Quasars

Corresponding author: Uendert Andrade

arXiv: 2503.14742

Summary: The DESI DR2 BAO analysis significantly improves constraints on cosmic expansion by leveraging a larger dataset of galaxies and quasars compared to DR1. Our results confirm the robustness of BAO as a standard ruler and achieve a factor of ~2 improvement in precision, reducing statistical uncertainties to ~0.24%. A key plot (below) showcases the stability of BAO constraints across different data vectors and modeling choices, ensuring the reliability of our findings for cosmological inference.

Extended Dark Energy analysis using DESI DR2 BAO measurements

Corresponding author: Kushal Lodha

arXiv: 2503.14743

Summary: In this paper, we perform an extensive analysis of dark energy using the latest DESI data, combined with CMB and SN Ia observations. Using a variety of parametric and non-parametric methods, our results indicate that extending the standard ΛCDM model with a two-parameter w(z) sufficiently captures trends in the current data. The evidence for dynamic dark energy, especially at low redshift (z<0.3), is robust across various methods.

The comparison of Gaussian Processes reconstruction of the dark energy equation of state w(z) with the w0wa parameterization using DESI, CMB, and Union3 data is shown in the figure below. See Figure 10 in the paper for more details.

Constraints on Neutrino Physics from DESI DR2 BAO and DR1 Full Shape

Corresponding author: Willem Elbers

arXiv: 2503.14744

Summary: We have pushed measurements of the Universe’s most elusive particles—neutrinos—to new limits by analyzing the positions of millions of galaxies. The results indicate that the combined mass of all three neutrino types is less than 0.0642 electron volts—a value that creates tension with the lower limit of 0.059 eV established by laboratory experiments. Statistical methods surprisingly indicated physically impossible negative masses, pushing the tension to a significance of 3σ. When allowing for evolving dark energy, the tension disappeared with a revised upper limit of 0.163 eV—potentially signaling new physics beyond the standard cosmological model.

Data Release 1 (DR1)

In addition to the papers described above, DESI’s first year data release (DR1) is now publicly available. The corresponding paper below provides an in-depth overview of this release.

The seven categories in which DESI DR1 results are organized, placing Data Release 1 in context of previous cosmological results. Credit: Gustavo Niz and Alejandro Aviles

Data Release 1 of the Dark Energy Spectroscopic Instrument

arXiv: 2503.14745

Summary: This paper describes DESI public Data Release 1, covering the first year of DESI main survey observations and a consistent reprocessing of Survey Validation data previously released in the Early Data Release. DR1 includes high-quality redshifts for 18.7M objects, of which 13.1M are spectroscopically classified as galaxies, 1.6M are quasars, and 4M are stars.

This figure shows a slice of the universe mapped by the DR1 data, showing the four major galaxy samples. See Figure 1 in the paper for more details. Credit: Claire Lamman

Filed Under: blog, feature on homepage

On November 19, DESI released another set of papers based on year one (Y1) data. The first set of papers, summarized here, was released on April 4 and focused on a particular feature seen in the clustering of tracers called the Baryon Acoustic Oscillation (BAO) standard ruler. These new results provide an extended, “full-shape” analysis of the Y1 data by looking at how galaxies and quasars cluster on different scales, both in the plane of the sky and along the line of sight in redshift space. This page contains a guide to the publications and main results. The papers are available here and on arXiv.

This visualization was made from simulated DESI data and displays the shift in galaxy positions between real and redshift space. Because galaxy distances are inferred from their recessional velocities, galaxy motions result in shifted positions along the line of sight (LOS) in a redshift map. On smaller scales, galaxy positions are “smeared” along the LOS as they rotate within clusters. On larger scales, galaxies fall into dense regions and their positions become “squashed” along the LOS. The latter of these is the type of redshift-space distortion (RSD) that contains information about the growth rate of structure. The simulated box is 500 Mpc/h across, 300 Mpc/h deep, and points are colored by depth. Credit: Claire Lamman and Michael Rashkovetskyi / DESI collaboration

Helpful links

  • A press release containing a high-level overview of our main results: https://newscenter.lbl.gov/2024/11/19/new-desi-results-weigh-in-on-gravity/
  • A short video on our results: https://www.youtube.com/watch?v=cVkUumMP6CI
  • A list of current papers: https://data.desi.lbl.gov/doc/papers/ 
  • For more background on DESI’s science, see our public webpages.
  • DESI’s Y1 data is not yet public, but you can find our early data release and any updates on this site: https://data.desi.lbl.gov/doc/releases/

The Y1 results fall into seven main categories. The three highlighted in blue, based on BAO measurements of galaxies and quasars (DESI 2024 III), BAO with the Lyman-alpha forest (DESI 2024 IV), and cosmological inference from these BAO measurements (DESI 2024 VI), were released on April 4. The three highlighted in pink are released on November 19; the construction of galaxy and quasar catalogs for cosmological analyses (DESI 2024 II), full-shape clustering measurements from galaxies and quasars (DESI 2024 V), and cosmological constraints from this full-shape modeling (DESI 2024 VII). This figure shows the publication organization, where each category corresponds to a key collaboration paper with several supporting papers. Summaries for the key papers highlighted in pink, as well as supporting papers, are listed below.

The seven categories in which the DESI 2024 papers are organized. Each topic consists of one key collaboration paper and several supporting papers. The papers of three of these categories (highlighted in pink) are released on November 19. The corresponding supporting and value-added papers are listed below. Image credit: Gustavo Niz
Image credit: Gustavo Niz


November 19 Paper Summaries

Construction of Galaxy and Quasar Catalogs

Creating galaxy and quasar catalogs is essential for DESI’s cosmological analyses. These papers describe how these catalogs were constructed from the forthcoming DESI Data Release 1 (DR1), and include studies of the effects of systematics and incompleteness on the clustering measurements.

DESI 2024 II: Sample Definitions, Characteristics, and Two-Point Clustering Statistics

arXiv: 2411.12020

Summary: This paper presents the details of the DESI ‘large-scale structure (LSS) catalogs’ constructed using data from DESI DR1. It further presents the details of how 2-point clustering measurements and their covariance are calculated using the LSS catalogs.

This plot shows the 2-point clustering measurements in multipoles for the DESI LRG sample, split into three redshift bins. The left-hand panels show the results in configuration space, while the right-hand panels show the results in Fourier space. There is excellent statistical agreement between the mean of 25 mock datasets (black curves) and the DR1 LRG data (colored points).

Characterization of DESI fiber assignment incompleteness effect on 2-point clustering and mitigation methods for DR1 analysis

Corresponding author: Davide Bianchi

arXiv: 2411.12025

Summary: The fiber assignment incompleteness, arising from the limited mobility of the robotic fiber positioner in the DESI focal plane, leads to a scale-dependent suppression of the observed galaxy clustering amplitude. If left uncorrected, this effect can significantly affect the inference of cosmological parameters. In this work, we summarize the methods used to simulate fiber assignment on both mock galaxy catalogs and real data, and we discuss the mitigation strategies we implemented to address this issue. We conclude that we can robustly correct for the fiber incompleteness in DESI DR1, as demonstrated in Figures 11 and 12.

Mitigating Imaging Systematics for DESI 2024 Emission Line Galaxies and Beyond

Corresponding author: Alberto Rosado-Marín

arXiv: 2411.12024

Summary: This paper details the angular systematic treatment used for the DESI DR1 emission-line galaxies (ELGs). Separately, we introduce a new methodology for systematic treatment by combining forward-modeling and regression. Furthermore, we present the impact of imaging systematics on the 2-point clustering measurements of BGS, ELGs, LRGs, and QSOs. We also assess the impact of imaging systematics on the BAO measurement.

Full-Shape Analysis from Galaxies and Quasars

The DESI key papers released in April focused on extracting information from the BAO scale. This new set of papers extends this analysis to extract cosmological information from the full shape of the 2-point clustering statistics, allowing for tighter constraints on cosmological parameters. This is the largest dataset ever used to perform a full-shape analysis, with over 4.7 million galaxy and quasar redshifts spanning 0.1 < z < 2.1. The combined precision on the amplitude of the redshift space distortion (RSD) signal, which probes the growth of structure, is 4.7%. Remarkably, this level of precision from just one year of DESI data is comparable to that of 20 years of data from the Sloan Digital Sky Survey (SDSS).

DESI 2024 V: Full-Shape Galaxy Clustering from Galaxies and Quasars

arXiv: 2411.12021

Summary: For the first time, we have performed a “full-shape” analysis of the galaxy 2-point statistics that extracts information beyond the cosmic ruler, the Baryonic Acoustic Oscillations (BAO), and probes the formation of large-scale structures under gravity. We use a sample of galaxies and quasars collected during the first year of DESI. Our galaxy full-shape analysis is in agreement with BAO for the background evolution and confirms the validity of general relativity as our theory of gravity at cosmological scales.

This figure shows measurements of the growth of structure parameter as a function of redshift, fσ8(z), from DESI DR1 (colored symbols) and the full SDSS program (gray symbols). For comparison, the colored lines represent a range of -0.5 <  μ0 < +0.5, a parameterization of modified gravity models that changes the strength of the gravitational interaction. The case μ0 = 0 corresponds to general relativity, represented with black dashed lines.

Exploring HOD-dependent systematics for the DESI 2024 Full-Shape galaxy clustering analysis

Corresponding author: Nathan Findlay

arXiv: 2411.12023

Summary: We explore how changing the model of how galaxies form affects the cosmology we infer. We find this to have a very minor effect (Figure 6) and include it as an extra uncertainty in our analysis following a new, more generally applicable approach.

Cosmological Inference

This set of papers provides a cosmological interpretation of the full-shape (FS) analysis described above, combined with the previous BAO analysis. These FS+BAO results constrain the density of matter, Ωm, the amplitude of mass fluctuations, σ8, and the Hubble constant, H0, for a flat ΛCDM cosmological model. Additionally, combinations of DESI (FS+BAO) with CMB and Type 1a supernovae continue to favor an evolving dark energy component. The DESI (FS+BAO) data is also used to test for deviations from general relativity, and results show agreement with it.

DESI 2024 VII: Cosmological Constraints from the Full-Shape Modeling of Clustering Measurements

arXiv: 2411.12022

Summary: Analysis of the first year of DESI data, in combination with other probes, shows preference for a cosmological model where the dark energy density evolves in time. This corresponds to the preference of the parameter w0 in the accompanying plot being different from -1, and wa different from 0. This result persists when we go beyond our earlier analysis of baryon acoustic oscillations signature in the clustering of galaxies, quasars, and features in quasar spectra, and extend it to utilize the full clustering signal of these cosmological tracers. When combined with Planck18 data, our data also tightly constrains the sum of the neutrino masses, which has to be below 0.071 eV.

This figure shows constraints on w0 and wa in the dark energy equation of state parameterization w=w0+wa(1-a). The solid contours represent constraints based on the new DESI (BAO+FS) analysis combined with CMB and PantheonPlus, while the dashed contours represent the previous BAO-only DESI data and the same combinations with external datasets.

Modified Gravity Constraints from the Full Shape Modeling of Clustering Measurements from DESI 2024

Corresponding author: Mustapha Ishak

arXiv: 2411.12026

Summary: We have analyzed the data from the first year of DESI allowing for different deviations from general relativity. This analysis combines DESI with CMB data and DES Y3 and is performed at different cosmic times and scales using various methods. We conclude that current data is consistent with general relativity (e.g. μ0 and Σ0 are consistent with 0 in the plot below) and that it still favors an evolving dark energy (wa not 0 and w0 not -1 in the plot below).

BAO Measurements from Galaxies and Quasars

In addition to the papers above, an additional supporting paper for the key paper DESI 2024 III: Baryon Acoustic Oscillations from Galaxies and Quasars, released in April, is now available.

Analytical and EZmock covariance validation for the DESI 2024 results

Corresponding author: Daniel Felipe Forero Sánchez

arXiv: 2411.12027

Summary: In cosmology, estimating uncertainties in large-scale structure analyses is crucial. Two methods are used: analytical covariance, which is fast and flexible but limited in handling complex systematics, and sample covariance, which is more accurate but resource-intensive. For the completed DESI 2024 analyses, analytical covariance is chosen for Baryon Acoustic Oscillations (BAO), while corrected sample covariance is used for Full-Shape analysis due to better accuracy in Fourier space.

Filed Under: blog, feature on homepage

Primary Sidebar

Copyright © 2018 Dark Energy Spectroscopic Instrument [DESI]

  • / science /
    • science overview
    • cosmology and dark energy
    • redshifts and distance
    • mapping the universe
    • the DESI science mission
    • the DESI survey
    • imaging surveys
  • / instrument /
    • instrument overview
    • telescope
      • tohono o’odham
    • corrector
    • focal plane system
    • fiber system
    • spectrograph
    • instrument control system
    • data systems
    • bringing DESI to life
      • commissioning Instrument
      • protoDESI
  • / collaboration /
    • DESI team
    • DESI builders
    • collaborating institutions
    • sponsors
    • code of conduct
    • vendors
    • collaboration policies
  • / press /
    • announcements
    • in the news
    • press releases
    • tweets by desisurvey
    • blog
    • acknowledgments
  • / galleries /
    • videos
    • image gallery
  • / for scientists /
    • data releases
    • instrument design
    • imaging data
    • target selection and survey validation
    • theory and simulations
    • other DESI science
    • key publications
    • all DESI papers
    • team login
    • request a DESI speaker
    • internal
  • / education & outreach /
    • meet a DESI member
    • blog
    • planetarium show
    • DESI high
    • interactive visualizations
    • DESI Merch

Footer

TEAM LOGIN

twitter   instagram   facebook

Copyright © 2018 Dark Energy Spectroscopic Instrument [DESI]

Copyright © 2025 · Parallax Pro DESI on Genesis Framework · WordPress · Log in