by Nico Schuster (CPPM)
7 July 2026
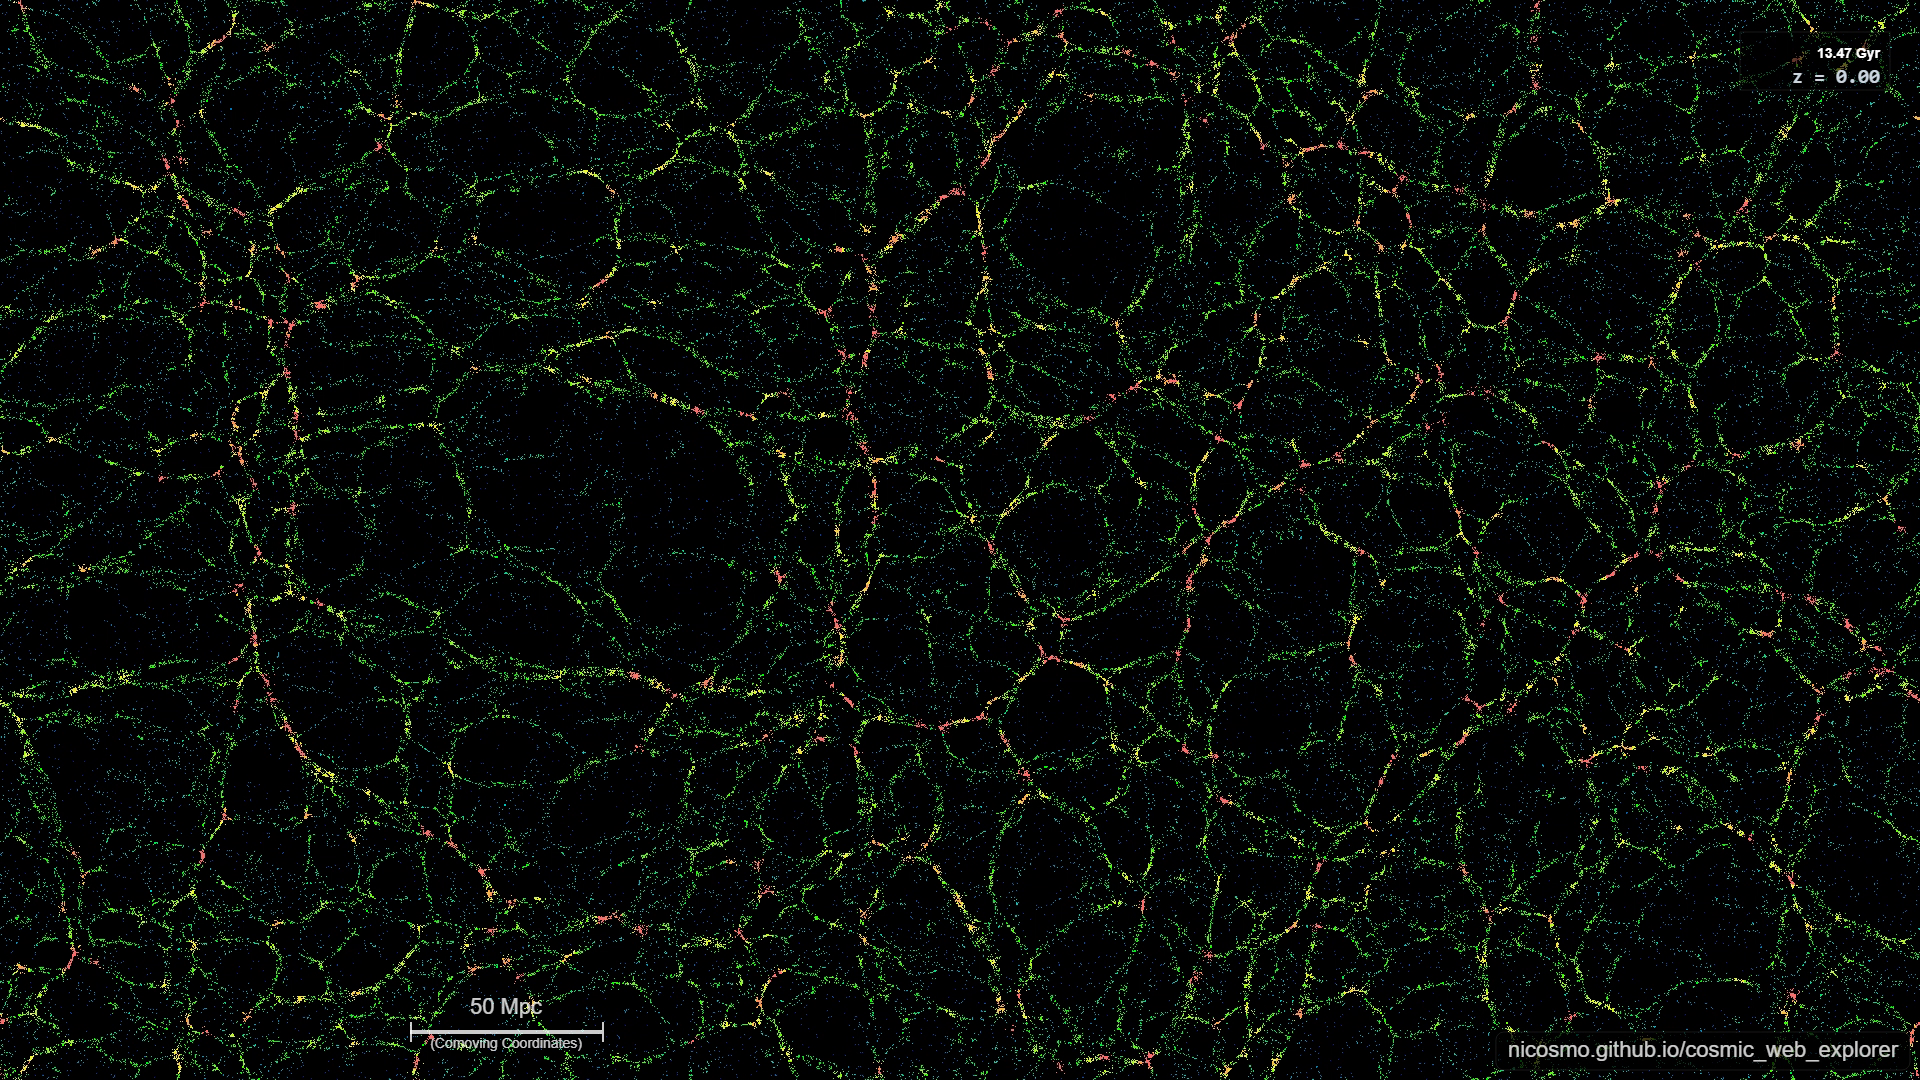
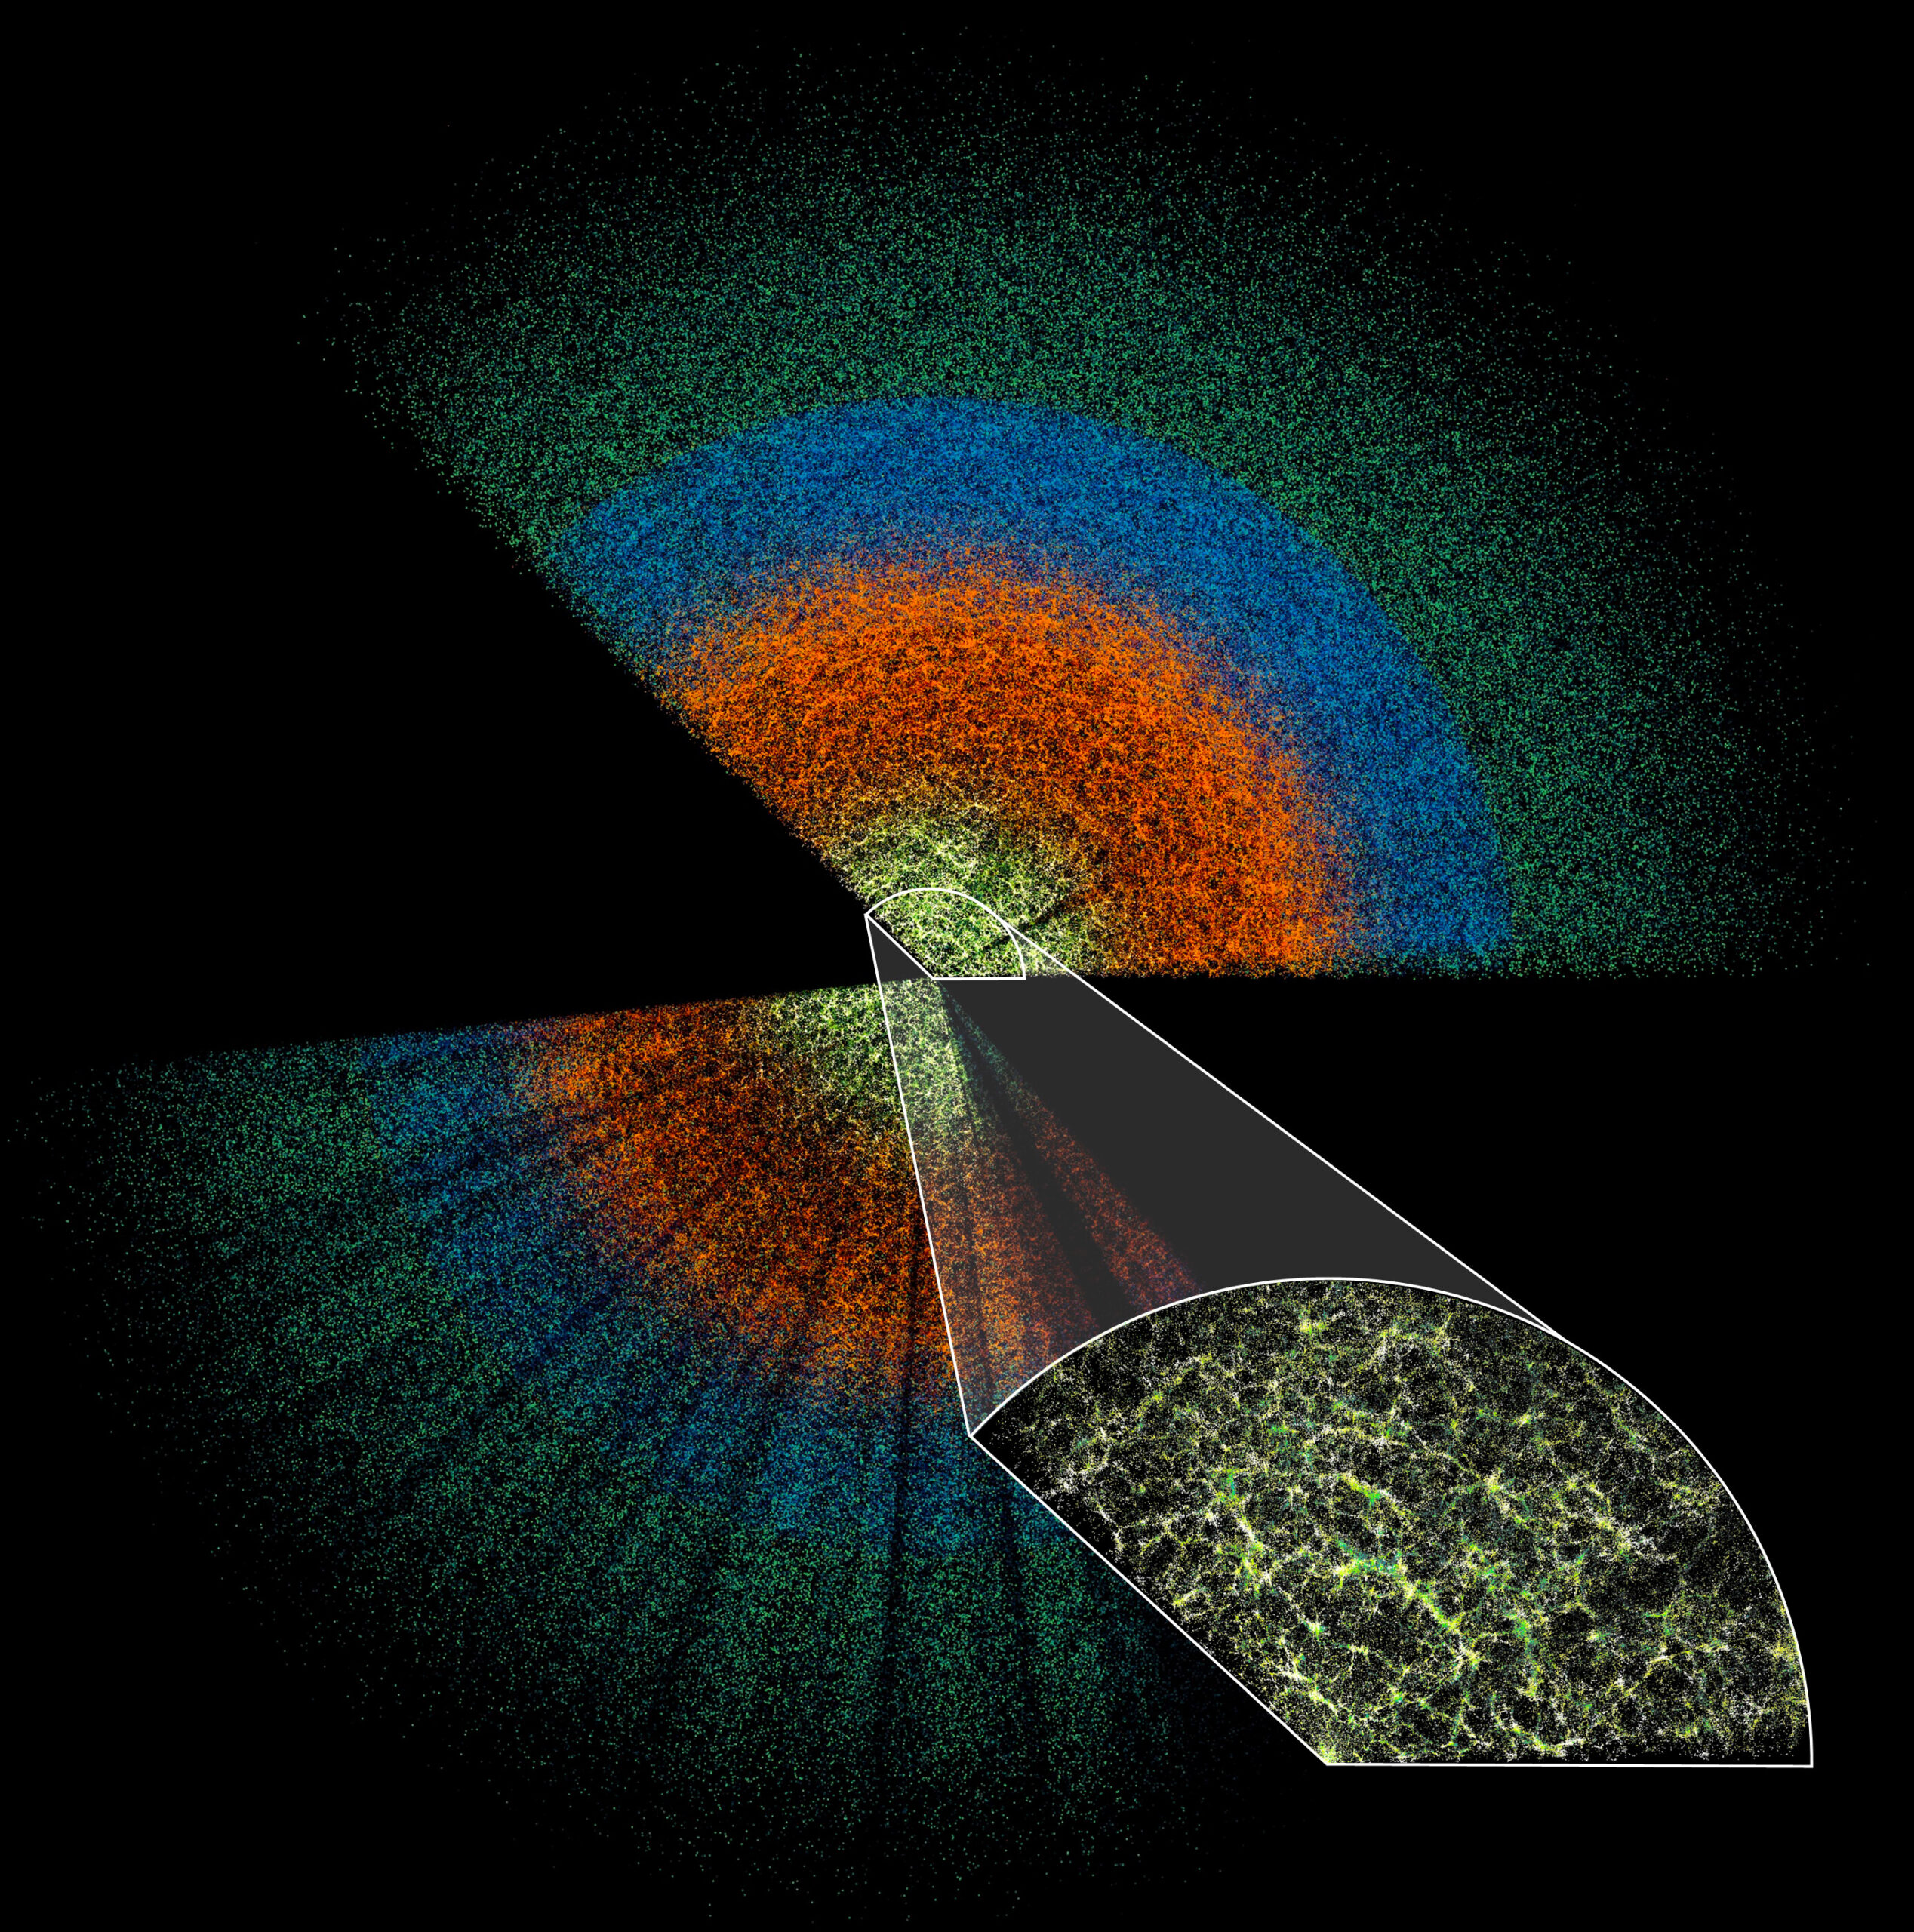
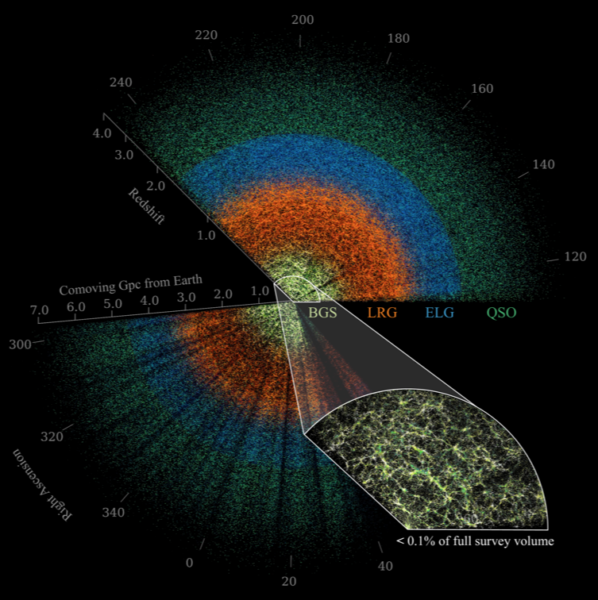
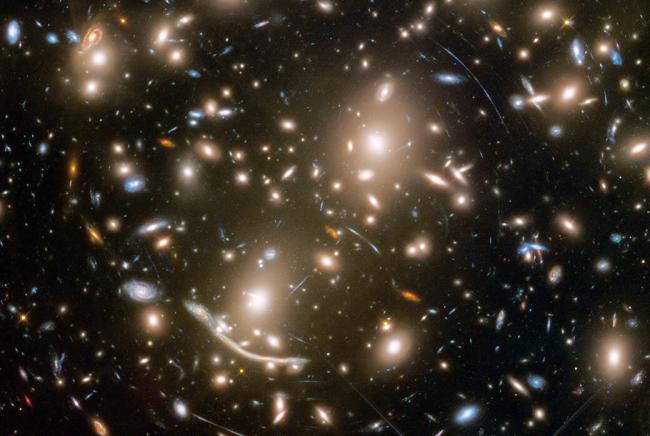
When we look at the positions of the millions of galaxies DESI has measured, one thing jumps out immediately: galaxies are not spread out evenly. Instead, they clump and string together into a cosmic web: bright filaments of galaxies threaded around huge, almost empty voids, which are some of the largest structures in the universe. However, this web was formed by two invisible ingredients, whose nature we are trying to uncover. One ingredient, dark matter, pulls everything together, while the other, dark energy, pushes everything apart. Together, these two components make up about 95% of the universe, while everything we can actually see, every star and galaxy, is part of the remaining 5%. Although we cannot see these parts of the dark universe directly, we can see the structures they leave behind, how they evolve, and the imprints of this tug of war between gravity and expansion.
Build Your Own Universe
The Cosmic Web Explorer is a way to play with that tug of war yourself. A small cosmic structure simulation that runs in your browser—no install required—it follows tens of thousands of particles from the early universe down to today. Think of these particles as stand-ins for galaxies rather than galaxies themselves. They mark where matter piles up, which is where DESI’s galaxies live, but their number stays fixed from a redshift of 10 onward. You choose how much matter and dark energy your universe gets, hit play, and the web grows in front of you. Try it here. A quick note on what you are seeing: the simulation divides out the overall expansion of space (it uses comoving coordinates), so the box never changes size. What grows is the clustering and the web itself, but not the box.
Behind the scenes, the code came together quite fast, with heavy help from AI coding assistants, used as a way to test how far they could be pushed on specific coding tasks. The answer was surprisingly far, provided scientists stayed in charge of the physics, decided what to include, and where the simple approximations needed refinement, while AI handled the implementation.
DESI and the Cosmic Web Explorer
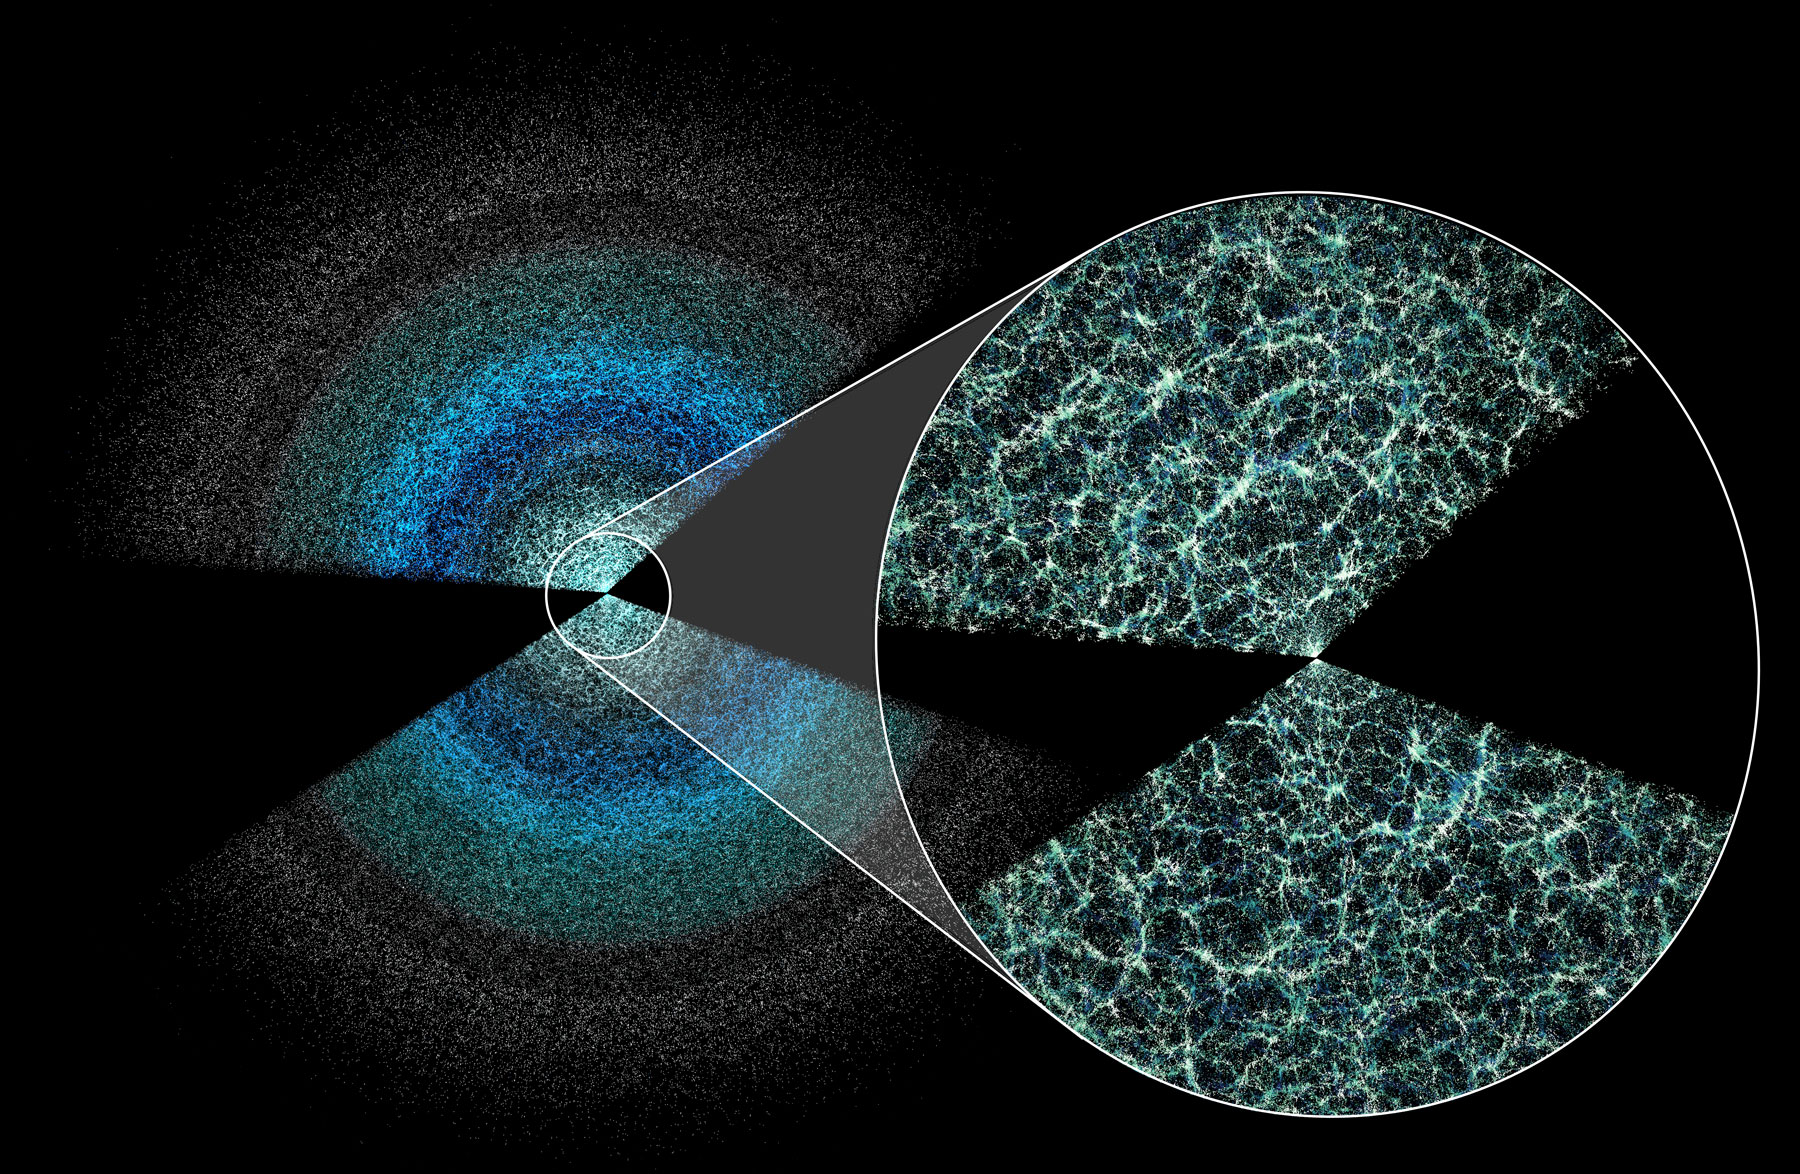
DESI, of course, does not get its cosmic web this easily. It spends years pointing at the night sky, measuring precise spectra of millions of galaxies, turning those into distances, and building the map of the web.
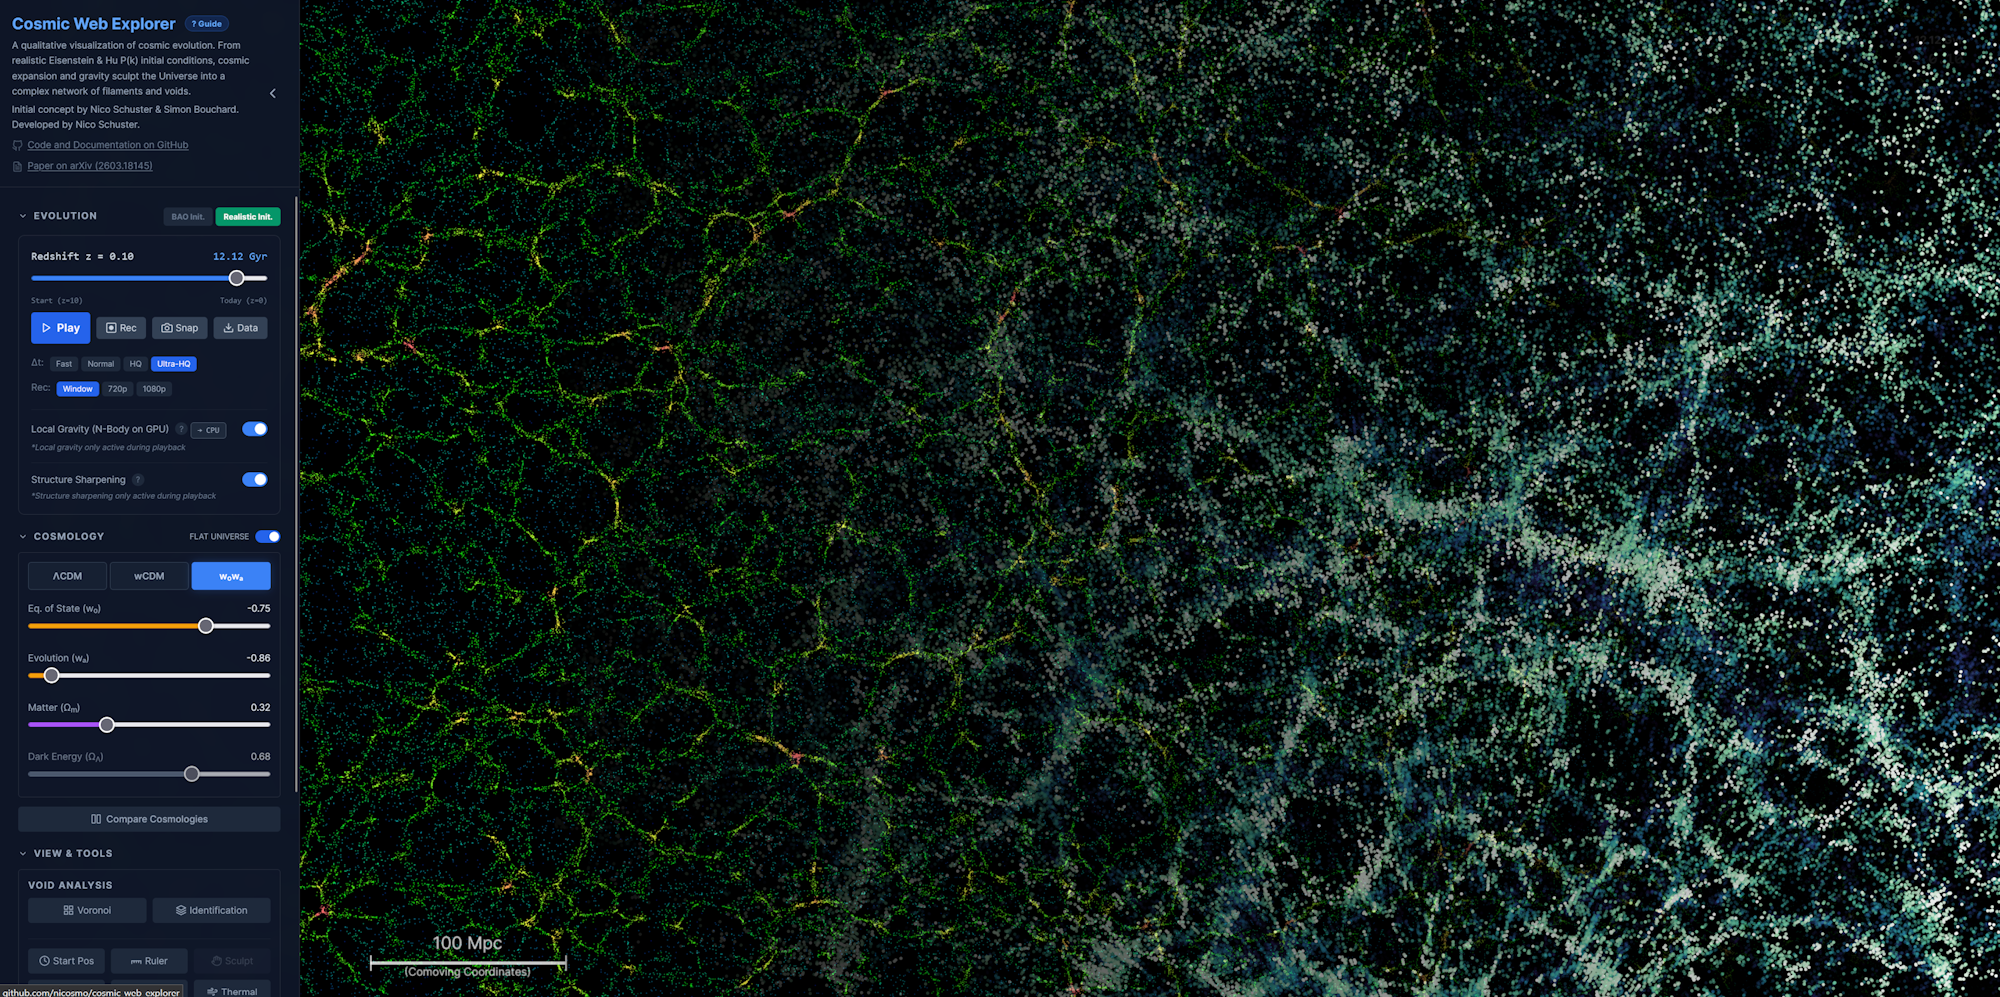
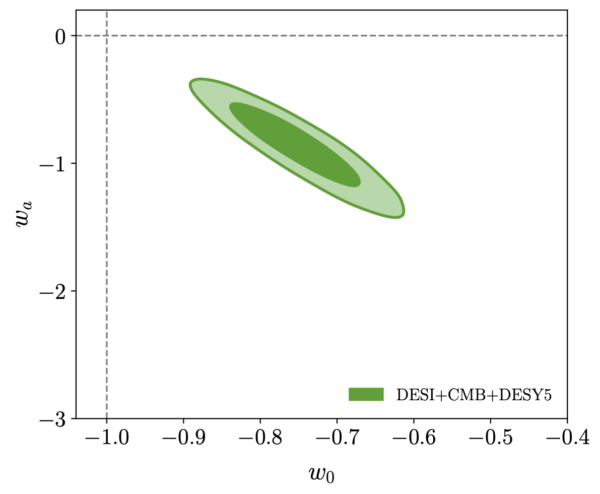
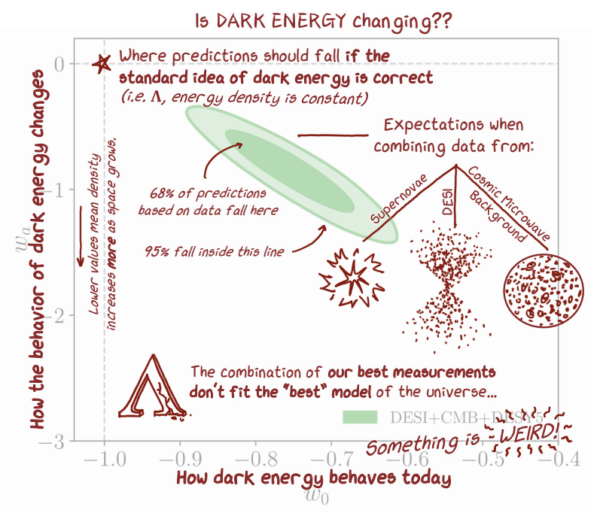
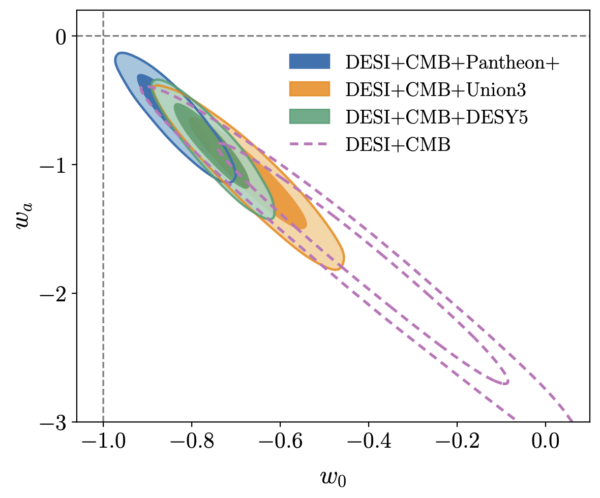
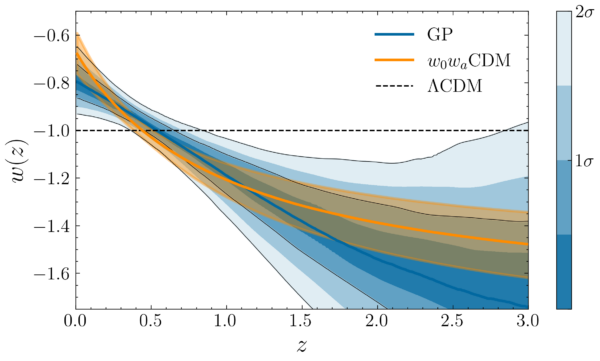
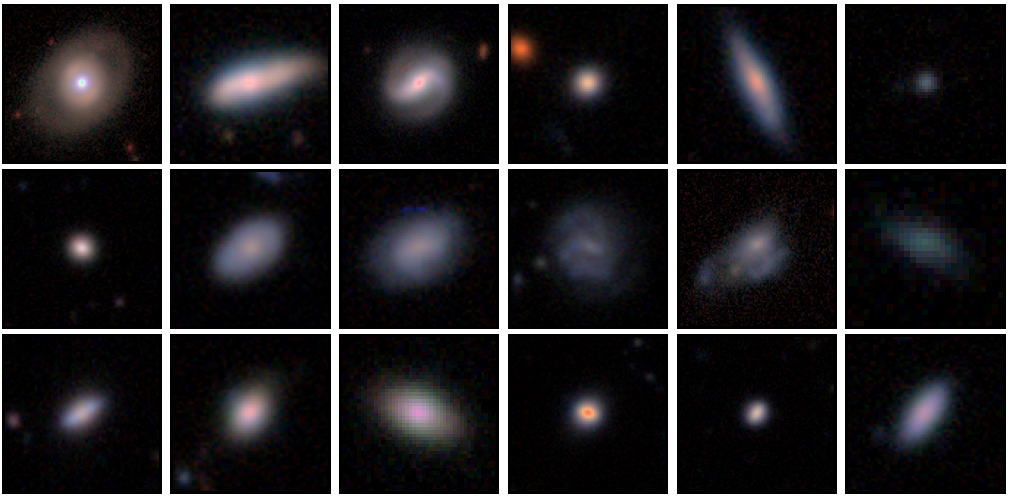
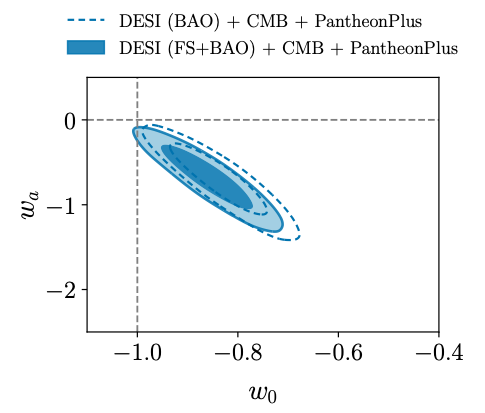
Put the simulation side by side with galaxies from the DESI Year 5 data (as in the image above) and the resemblance is obvious: very similar filaments and gaps. There is, however, a subtlety in those observed positions: they come from redshift, so each galaxy’s own velocity shifts where it appears along the line of sight compared to its true position. This redshift-space distortion is another thing DESI measures, and the Explorer has a redshift-space mode where you can switch it on and off. Underneath the web itself, two effects are competing. Gravity pulls matter together and grows the web. Dark energy works the other way, stretching space and slowing that growth down. The tool lets you control both. Turn up the matter density and structure clumps more strongly. Turn up dark energy, or change its equation of state (the parameters w0 and wa, which describe whether dark energy stays constant or evolves over cosmic time), and you can watch structure formation lose steam quickly.
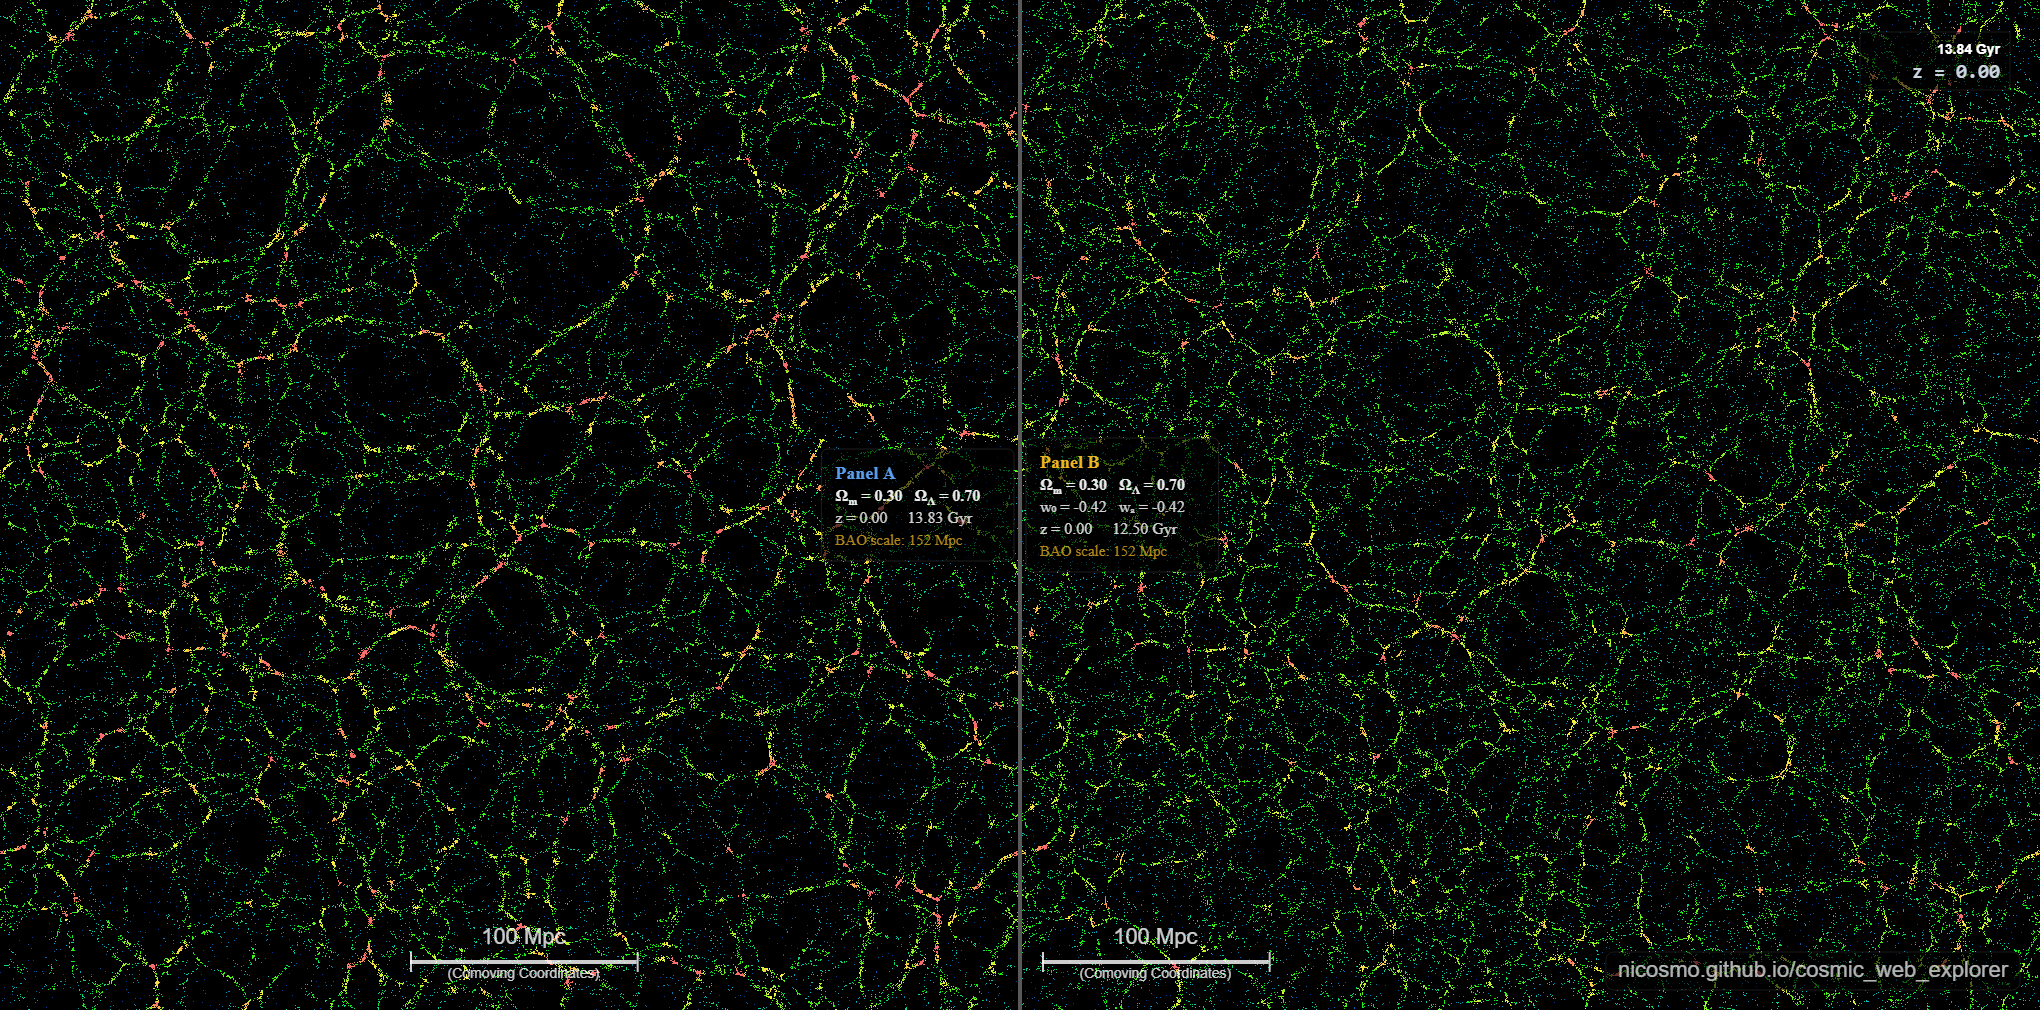
Try this yourself. Fix the matter content, then compare two universes: one with a plain cosmological constant (ΛCDM, the standard picture in which dark energy never changes), and one with a strongly evolving dark energy (w0wa, in which dark energy’s strength changes over time). Try to look closely. The honest result is that they come out looking nearly identical. You have to push the parameters to extremes before your eye can reliably tell them apart. That is not a flaw in the tool, but the whole reason DESI exists. The real differences are so small that we need the extraordinary precision of DESI to measure them.
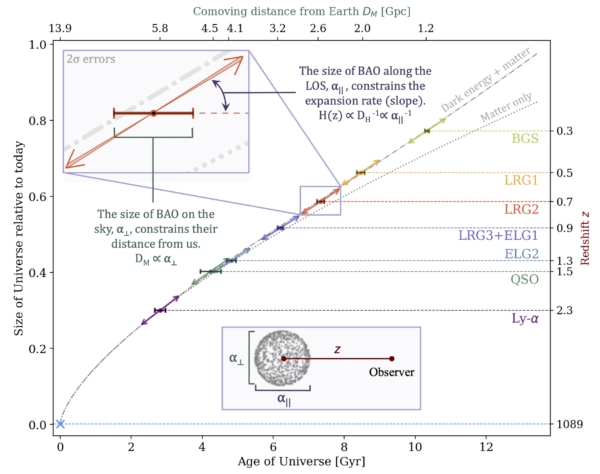
The BAO Scale
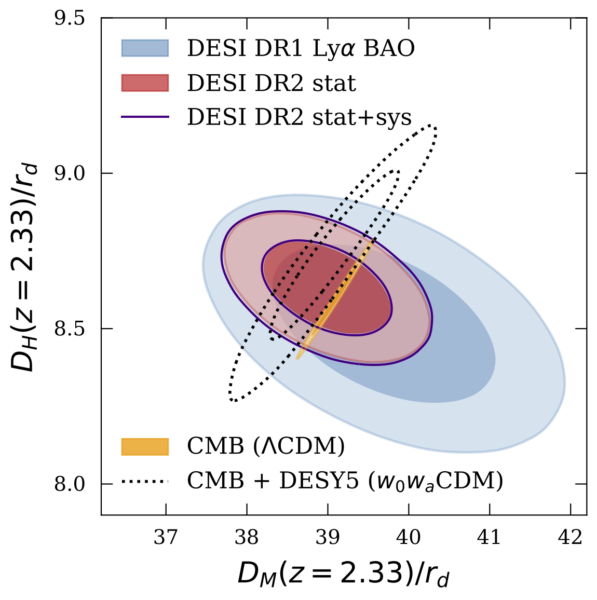
Unlike that small difference, there is one genuine signal you can bring into view. Hidden in the distribution of galaxies is a faint, preferred distance. Pairs of galaxies are very slightly more likely to be found at one particular separation than at neighboring distances, an echo of pressure waves from the hot early universe. This is the baryon acoustic oscillation (BAO) signal, and it is the standard ruler that DESI uses to measure the history of cosmic expansion. In the actual data it is small and easy to miss. So in the Explorer we added a dedicated ‘BAO’ mode that sculpts this preferred distance into the starting conditions, with an artificial amplification strong enough to see. Of course this distance depends on the composition of our universe, and now you can watch what DESI is chasing in its measurements.
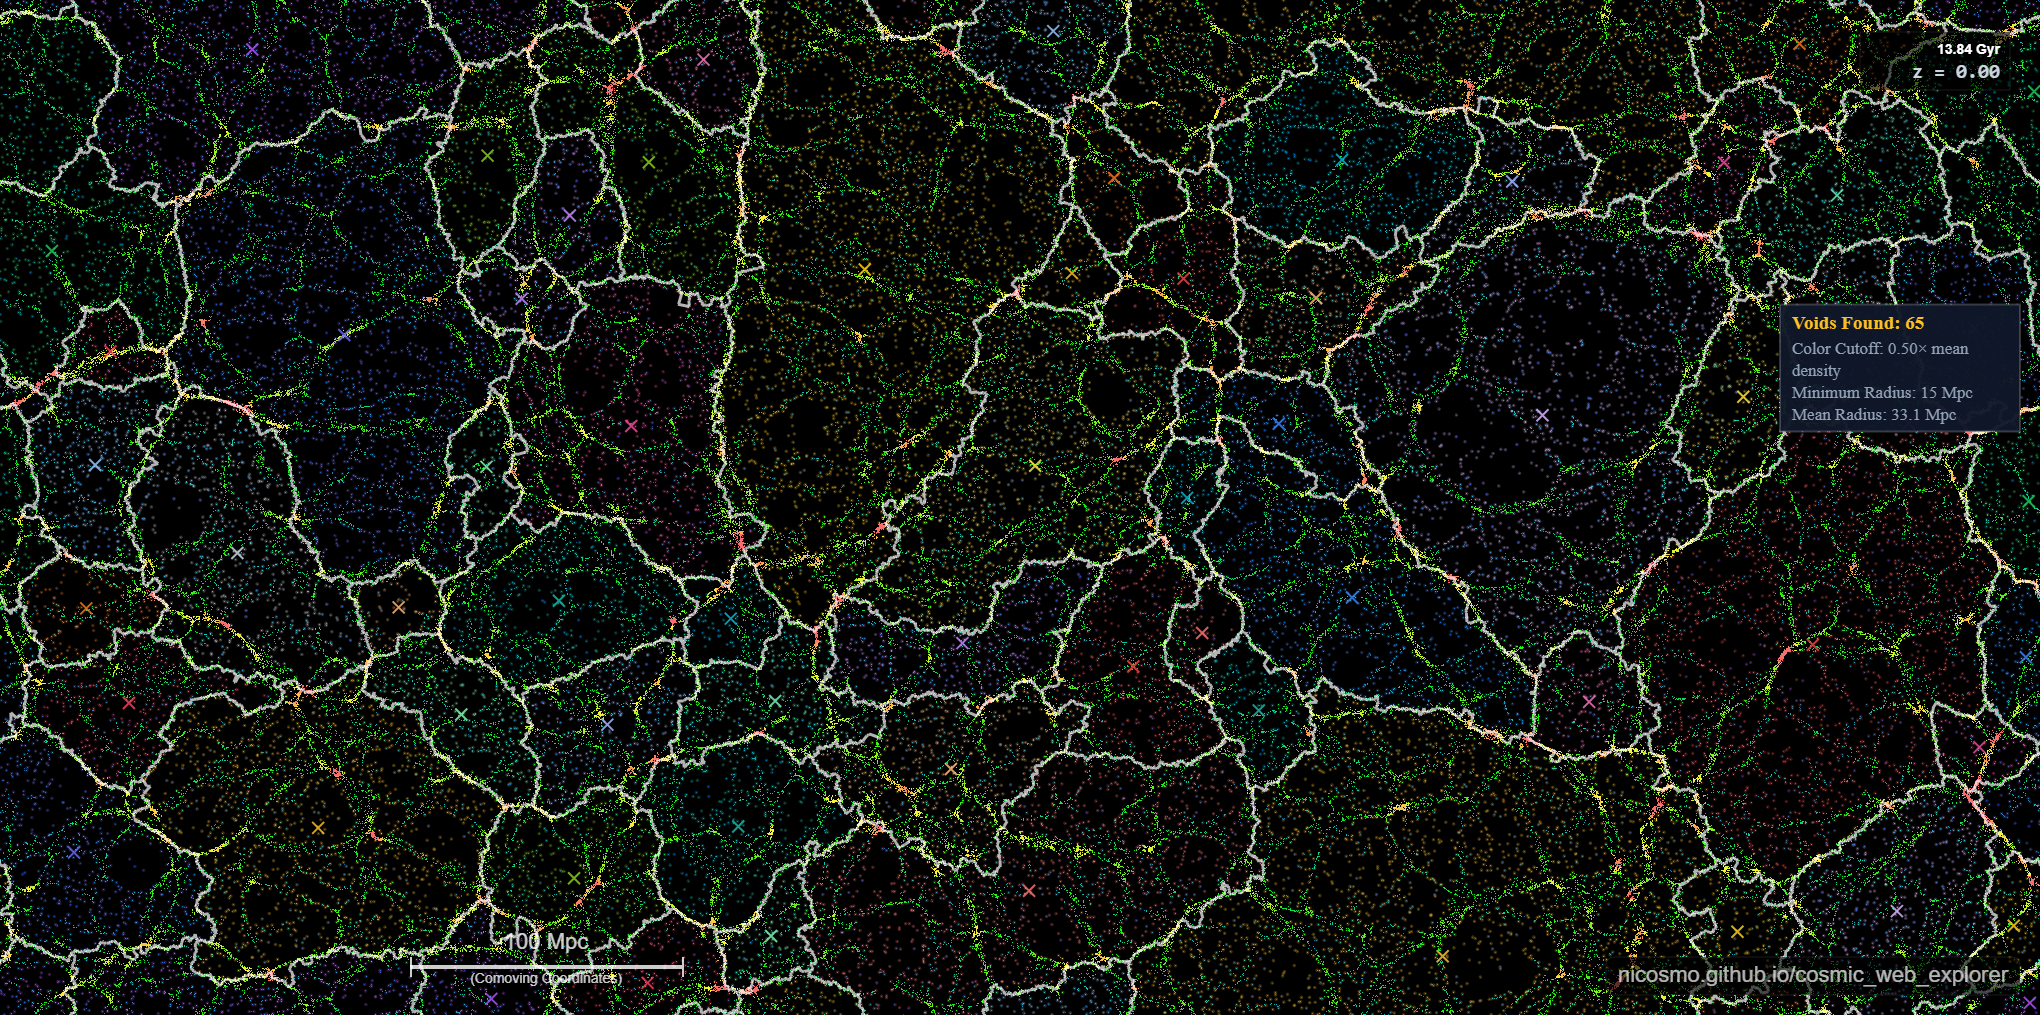
Cosmic Voids
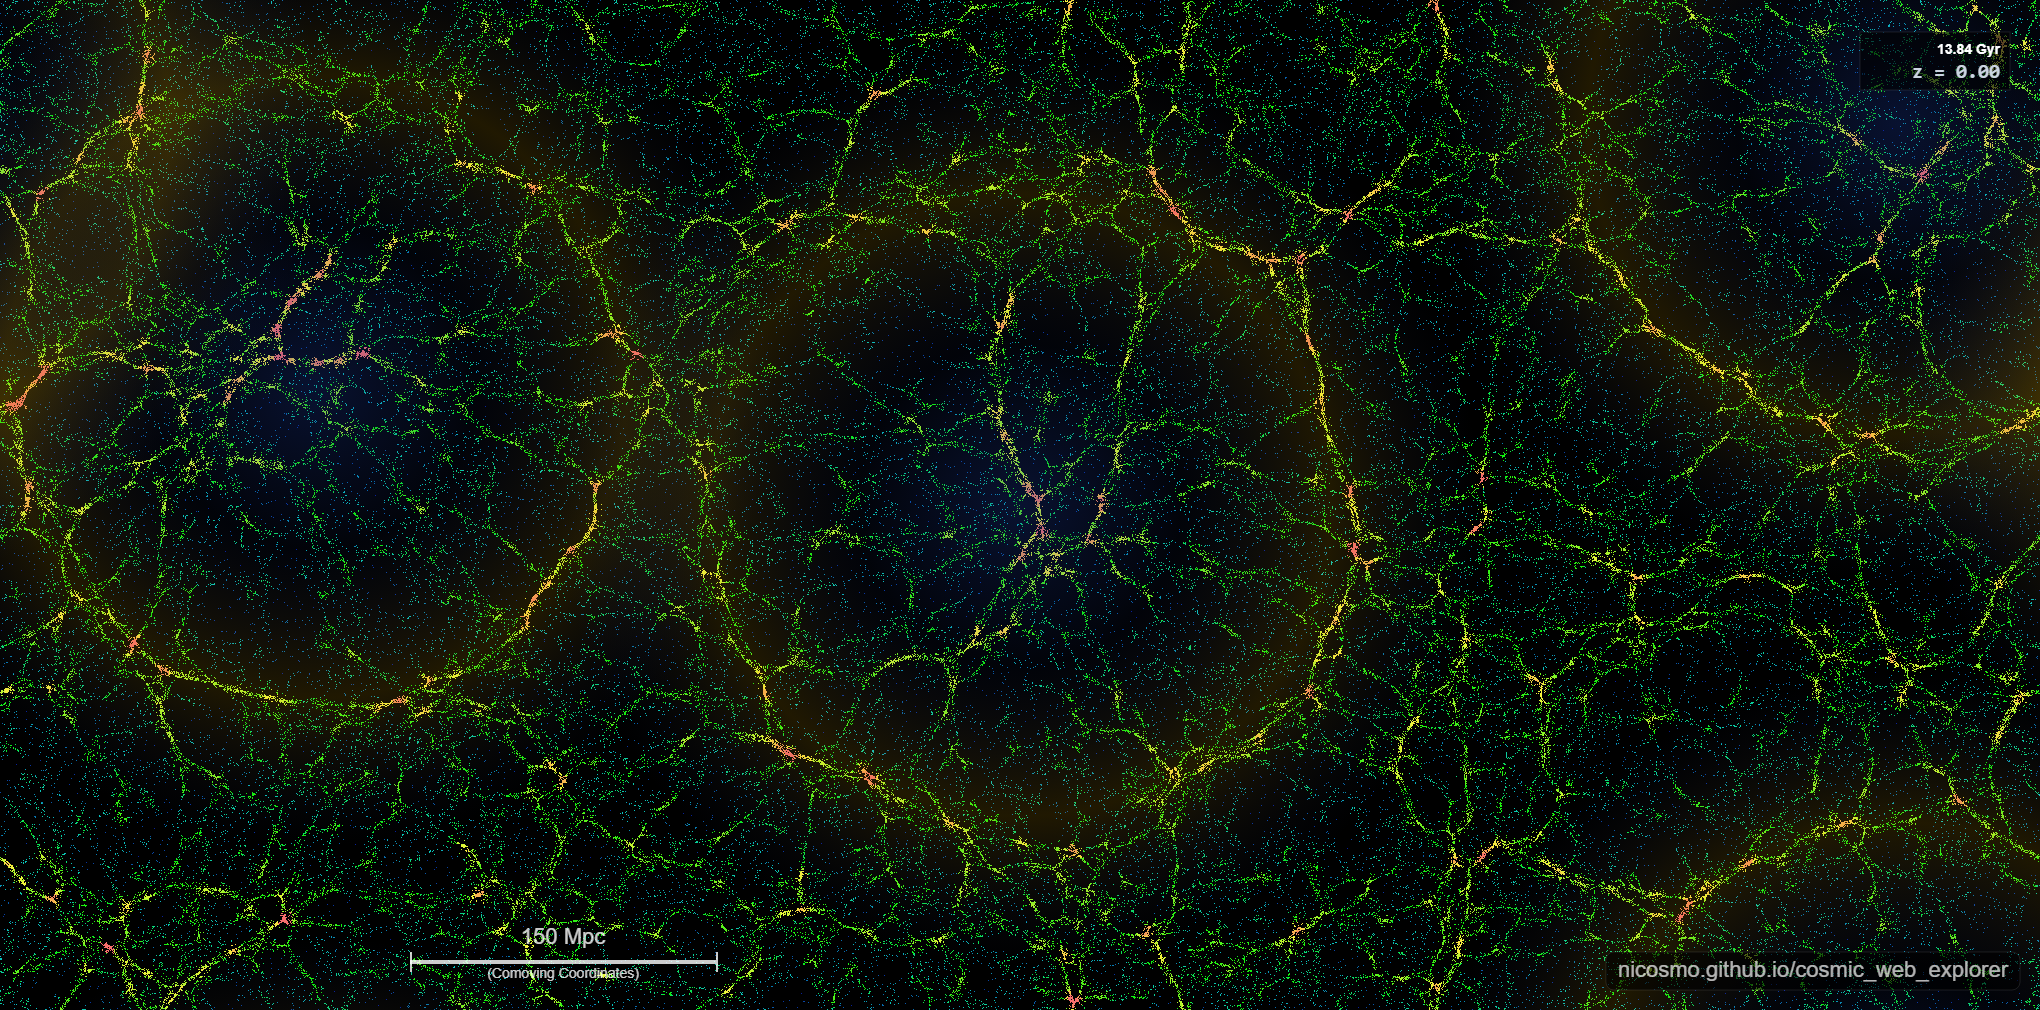
DESI measures far more than just the BAO scale: how strong galaxies cluster, how fast that clustering grows, and more. Among these probes are cosmic voids, where my own research sits. These voids are enormous underdense regions enclosed by clusters, filaments, and walls. They contain very little matter, yet they fill most of the volume of the cosmos. That near-emptiness turns out to be quite useful. With so little matter inside, gravity is gentler, which keeps void statistics within reach of simpler theoretical models. And because voids are so empty, faint effects that are hidden inside dense regions stand out in them: the way dark energy shapes the expansion, and even the small imprint left by massive neutrinos, whose speed keeps them from clustering the way ordinary matter does.
In our simulation we find voids the way we do in surveys: we locate the emptiest points and let each region grow outward until it runs into high-density walls and filaments, so every void has its own irregular shape, defined by the surrounding structures rather than by an assumed sphere. In the Explorer you can then watch voids appear, grow across cosmic epochs, and see how they change when you alter the physics of the simulated universe.
Built to Connect and Foster Intuition
There is a personal reason the Cosmic Web Explorer ended up this detailed. Voids did not spark the creation of the tool, but they shaped where it went. Wanting to see them form properly is what pushed me toward local gravity, adjustable tracer numbers, and most of the realism it now has. Getting all of this to run smoothly in a browser was the biggest challenge: every new feature or more accurate physics implementation had to be balanced against its computational cost. However, seeing the first realistic-looking cosmic web assemble in front of my own eyes was thrilling. Watching voids carve themselves out of the large-scale structure confirmed we had built something that felt real and that was genuinely fun to use. That mix of realism and fun is also the point: the Explorer exists to bring cosmology closer to people, for outreach, teaching, and giving a feel for what we work on and why we find these questions so exciting.
It is also worth being clear about what it is not. Like the amplified BAO rings, the whole visualization represents a thin, flattened slice of the universe with short-range gravity. The equations describing the large-scale movement of tracers are directly implemented from theoretical models, but to keep it running in real time in the browser, we had to make certain simplifications. The tool is therefore intended for intuition, not for absolute precision. For a more detailed picture, the code and notes are on GitHub, and we describe how it was built in our paper.
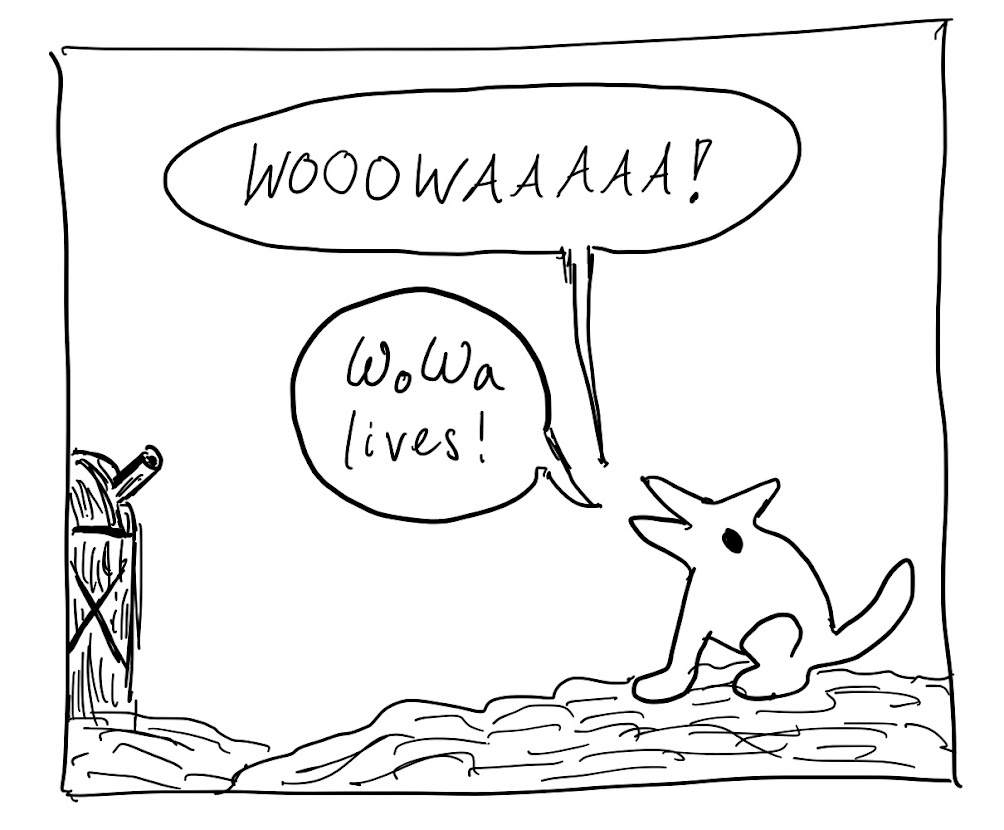
A final, less serious feature: with the right settings the cosmic web can be made to spell out a word as it forms (as in the video below), a deliberate fiction, albeit an enjoyable one. The best way to grasp any of this and to get closer to the science we do is to experience it yourself, so open the Cosmic Web Explorer, build your own universe in your browser, and see what happens when you change it.
About the author: Nico Schuster is a postdoctoral researcher at the Centre de Physique des Particules de Marseille (CPPM) in Marseille, France. In DESI he studies cosmic void statistics within the Alternative Clustering Methods Group. He is also involved in creating preliminary forecasts for cosmic voids with DESI-R2.
Edited by Joan Najita


 9 March 2026


 A graduate student at the Harvard-Smithsonian Center for Astrophysics, Claire Lamman studies the orientations and alignments of galaxies and what they can tell us about cosmology and the cosmic web. She is also a talented artist and the recipient of a National Academies of Sciences
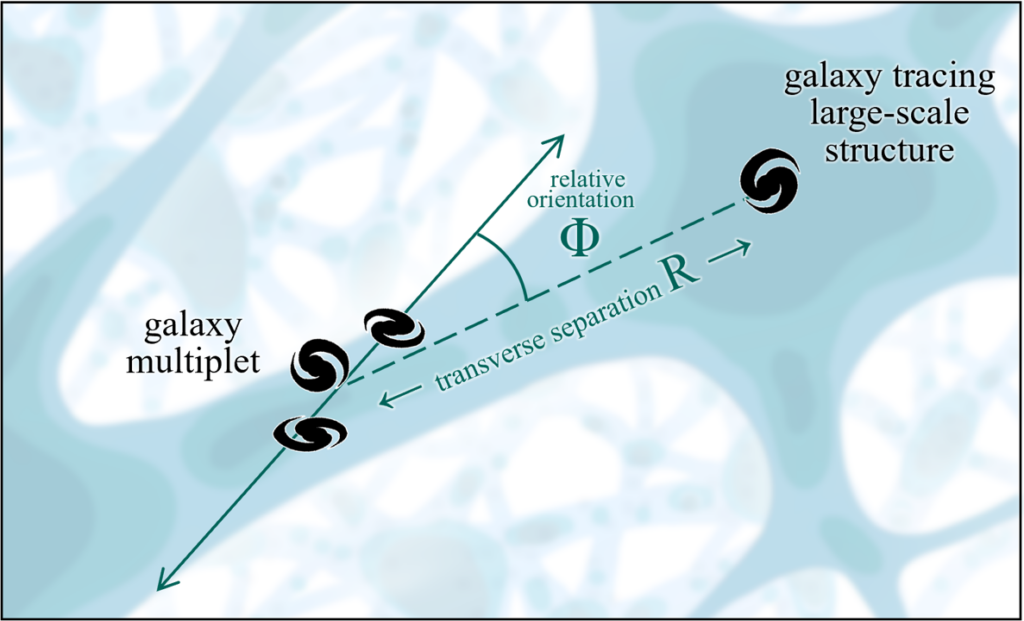


