…in Story and Science
Joan Najita, NOIRLab
April 4, 2023
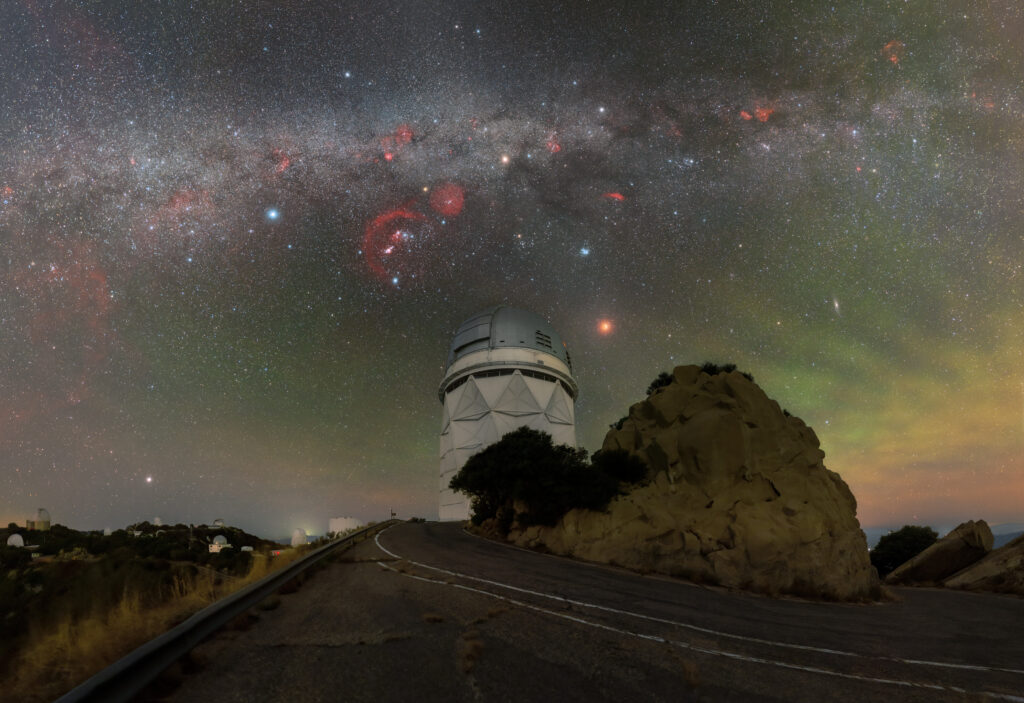
One of the most spectacular things in the night sky is the Milky Way, which arches above the 4-meter Mayall Telescope in this image. The DESI survey is currently underway at the Mayall Telescope at Kitt Peak National Observatory, which is located in the Schuk Toak District of the Tohono O’odham Nation. Known as “tohmog” or “to:mog” in the language of the Tohono O’odham, the Milky Way looks like a pale band of bright specks entangled with dark clouds and glowing red wisps that shimmer like fireworks. In one Tohono O’odham story, the Milky Way was created when Coyote, the trickster, was playing in the kitchen and looking for something to eat. Hearing someone coming, he grabs a bag of flour and escapes into the sky in a great hurry. The bag tears open and flour spills out, creating the Milky Way.
There’s an echo of that story in how astronomers understand the Milky Way, just with the light and dark reversed. Here the bright white specks are not powdery flour, but stars in our galaxy. And a different kind of powdery substance, interstellar dust, creates the dark clouds, by scattering and absorbing the light from background stars. This dust isn’t the same stuff we sweep up from under our beds. Instead, it’s a kind of “soot” that forms in the atmospheres of some stars and is the stuff from which planets like Earth are made. It’s pretty valuable stuff—just like the flour that Coyote ran off with!
In this image, we can also see other interesting features. The familiar constellation of Orion the hunter is just above the Mayall Telescope to the left. And the glowing red fireworks spread across the sky are bright clouds of gas in the galaxy that are lit up by hot stars.
 What is your position or role in the DESI project?
I am active in the Lyman-alpha Working Group and I am the chair of the Diversity, Equity, and Inclusion. Previously I served as Instrument Scientist during much of DESI’s construction and commissioning.
Where were you born?
I was born in Philadelphia, Pennsylvania.
Where do you live now?
I presently live in Columbus, Ohio.
What do you do as part of DESI?
I work with students and postdocs in the Lyman-alpha Working Group to improve our cosmological measurements. This includes cataloging Broad Absorption Line Quasars, developing machine learning methods to predict the quasar continuum, and identifying ways to decrease systematic errors in measurements of one- and three-dimensional correlations. I also work to find ways to make the collaboration better for all members and think about the design of the next major spectroscopic survey after DESI.
What is the most interesting or exciting thing about your job?
I love conducting research and the thrill of new discoveries. I also really enjoy mentoring more junior scientists.
Any advice for an aspiring scientist?
Look for opportunities to get involved in science no matter where you are in your education. While there is an incredible amount to learn to be a successful scientist, you do not need to know a lot to already start to contribute, and to experience what science is like. This is also a great way to meet other people excited about the same things you are, and that can make science even more fun. Lastly, while mentors are important, you are the most reliable advocate for yourself. Be bold and do not wait for opportunities to come to you.
What do you do for fun?
I enjoy activities with my family, including attending my kids’ activities, playing games, climbing, and travel. I also like to play classical piano music, read history books, and exercise.
 What is your position or role in the DESI project?
I am currently co-chair of the cosmological simulation working group. You will most likely find me on galaxy—halo connection, galaxy—quasar clustering, and weak lensing calls.
Where were you born?
A city of 8 million people in China that you probably have never heard of. 😉
Where do you live now?
I now live in a sunny neighborhood of San Francisco with my partner. Loving the fine weather and the diverse cultural experiences of the Bay Area.
What do you do as part of DESI?
I have been pushing on two key science aspects within DESI: understanding the intricacies of galaxy evolution, and constraining cosmology with small-scale information extracted through alternative statistics. We are finishing up a set of exciting papers that use early DESI data to reveal some interesting physics of galaxy evolution. On the cosmology side, we are developing a new simulation-based approach to build high-fidelity models of the Universe, which would allow us to tap into a ton of additional information that was previously inaccessible.
What is the most interesting or exciting thing about your job?
The process of seeing something unexpected in the data, and building hypotheses and intuition to explain the data is very rewarding. And when you finally stumble on the missing piece of the puzzle, it can be truly exhilarating. That said, I am still searching for that missing piece.
Any advice for an aspiring scientist?
Only do it because you love it. Don’t stress about it! And always prioritize your own health.
What do you do for fun?
I enjoy playing and watching all kinds of sports, but I most regularly play tennis. On the weekends, you will find me trying out a new restaurant, vibing to some funky disco at the local plant nursery, or just having a laugh playing games with my friends. And of course I am always down for a little getaway.
If you weren’t a scientist, what would be your dream job?
Probably a sailor, or a Youtube food vlogger.
What excites/interests you most about DESI?
Really looking forward to the surprises we will see in the data as we look towards new classes of galaxies, further back in time, and deeper into non-linear scales. Who knows what kind of new physics we are going to learn.
Lawrence Berkeley National Laboratory, 27 February 2023
 What is your position or role in the DESI project?
I am a PhD student working in the galaxy clustering group, where I work on generating high-fidelity mocks for DESI QSOs and studying their halo occupation distribution. I also take shifts as a Support Observer for DESI.
Where were you born?
I was born in New Delhi, India, but I have my roots in the South Indian state of Kerala, one of the most beautiful places in the whole world.
Where do you live now?
After my undergraduate studies in India, I moved to Texas, USA, to pursue my PhD at the Southern Methodist University in Dallas, Texas.
What do you do as part of DESI?
I work on probing the cosmic expansion of our Universe by studying how the large-scale structures are clustered. In DESI, I work on QSOs to generate high-fidelity mocks using the subhalo abundance matching (SHAM) technique, with the help of UCHUU simulations. I study two-point correlation statistics of this clustering and also find their halo occupation distribution (HOD). Twice a semester, I also take shifts as a Support Observer for DESI where I am in charge of afternoon calibrations and data quality assessment.
What is the most interesting or exciting thing about your job?
I have always wanted to study why the Universe is the way it is. Despite being just a speck of dust in the vastness of this universe, Astrophysics helps us to study the grandest events to ever have happened.
Any advice for an aspiring scientist?
Don’t give up on your dreams, and be ready to accept failures along with success. Curiosity, Commitment, and Patience are your best friends in research life. Take lots of notes, and When in doubt—always follow your notes.
What do you do for fun?
I enjoy playing table tennis, tennis, and cricket. I also enjoy watching them in my free time. I am a huge Potterhead and Lord of the Rings fan, so you can discuss anything from the Harry Potter or the Lord of the Rings world if you meet me. I also occasionally write poetry.
If you weren’t a scientist, what would be your dream job?
If not a scientist, I would have been a poet or a cricketer.
What excites/interests you most about DESI?
This job of being a beginner-level researcher with DESI provides me with an opportunity to realize my dreams of understanding the cosmos. The best part is the chance to collaborate with the greatest minds out there in this field. I get to interact with experts in theory, computation, and instrumentation. I get to learn new and interesting discoveries after attending each group meeting.

![]()
What is your position or role in the DESI project?
I coordinate the working group that will produce the Alcock-Paczyanski and Redshift Space Distortion measurements from the clustering of galaxies and quasars of the year 1 data release. Thanks to the effort of this group, and in coordination with other working groups, the DESI team will be able to place cosmological constraints such as the amount of matter in the Universe or infer how fast the Universe is expanding today.
Where were you born?
I was born in Barcelona.
Where do you live now?
After 6 years abroad I returned to Barcelona, where I now live and work.
What do you do as part of DESI?
I have many duties within DESI. Just a few examples, I organize weekly calls that help to coordinate the activities of the different groups working on similar topics. Along with close collaborators, I have also designed the blinding strategy for DESI, which will help us to perform an analysis free of human confirmation bias. I have also worked on new compression techniques that will allow a lossless compression, from the DESI catalog, which consists of 3D positions of millions of galaxies, down to a few parameters of interest, which can be interpreted in the light of different cosmological models. Such compression will greatly help the analysis and interpretation of DESI data.
What is the most interesting or exciting thing about your job?
Working with real data that no one has ever looked at or analyzed before! We just don’t know what the Universe will tell us when we complete DESI observations, and the moment we disclose that information and learn about new things is very exciting.
Any advice for an aspiring scientist?
I would say “follow your dream” and try to do what you like. Be curious, science is 90% hard work, but also 10% creativity. I’d say that a person that can be both hard worker and creative will definitely be a good scientist.
What do you do for fun?
I love being outside doing sports in contact with nature. I enjoy riding my bikes a lot (both road and mountain bike) and organizing bikepacking adventures with my friends.
 What is your position or role in the DESI project?
I am a member of DESI along with my graduate students and postdoc. In the past I have enjoyed helping out in a few different service roles in DESI such as publications board and co-chairing the C3 working group.
Where were you born?
I was born in a small town on the coast in Connecticut.
Where do you live now?
Now I live in Florida, where I am a professor at the University of Florida—which is farther from the beach than you’d think!
What do you do as part of DESI?
My group and I work on pushing forward 3-point correlation function and higher-order statistics to help us tighten our cosmological constraints as well as explore new physics during inflation like primordial non-Gaussianity and parity violation. I’m also part of an exciting secondary target project to get redshifts for WISE objects to improve the cross-correlation studies one can do with WISE and the cosmic microwave background (CMB).
What is the most interesting or exciting thing about your job?
I enjoy the idea that we can actually increase our knowledge of what the fundamental nature of reality is, both with studies aimed at understanding dark energy on a deeper level, and studies aimed at the very beginning of the Universe (inflation). Hibert said at some math congress in the early 1900s that “We must know; we will know” and I have always liked that phrase. it both conveys that fuller understanding of reality is an imperative, and an achievable imperative (so, it is optimistic).
Any advice for an aspiring scientist?
Nietzsche wrote somewhere “Become who you are, but not too early.” I think that’s good advice. Ultimately, I suspect that whatever original thing one is going to do in science will come out of pursuing one’s own particular, unique interests, in one’s own way, because that’s the only way to do something that everyone else isn’t already doing. So that’s how I see the first part. But I also think you shouldn’t restrict yourself too early based on “who you think you are” as a scientist. For instance, while probably what I enjoy the most is finding new mathematical ways to deal with problems, the work I’ve done that maybe has had the most impact actually came from developing algorithms. Recently I’ve gone as far as you can go from pen and paper and been trying to use Graphics Processing Units (GPUs) for cosmology. If I’d believed “who I am as a scientist” was just “pen and paper”, I would have closed myself off from that latter opportunity.
What do you do for fun?
I enjoy classical music a lot (both going to the symphony and playing the viola) and also watching English detective shows.
If you weren’t a scientist, what would be your dream job?
Probably being a classical musician, maybe one of the few careers even harder to find a permanent job in than academia. I also think I’d enjoy being an antiques dealer, but I’d have trouble ever parting with anything to sell it.
What excites/interests you most about DESI?
The people! Covid really brought home to me that having a community to learn from and interact with is an essential ingredient that makes science much more fun. It has been really interesting to go from being a graduate student in DESI to a postdoc to a faculty member, and I think that’s been a great opportunity to get to know people in pretty much every seniority layer of DESI on their own terms.
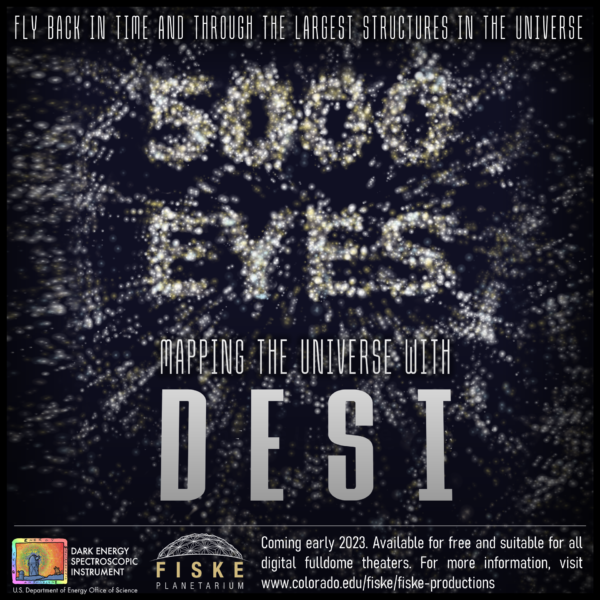
The trailer for DESI’s very own planetarium show is out! 5000 Eyes: Mapping the Universe with DESI will be available in March 2023 and free to all planetariums. Explore what DESI is all about: watch a sunset on Kitt Peak, be an ant inside the forest of robots, and soar through the DESI Year 1 data.
Recovering from the Contreras Fire
Benjamin Weaver, NOIRLab
January 24, 2023
DESI collaborators have previously reported on the Contreras Fire and how it initially affected DESI operations along with an update as personnel were able to return to Kitt Peak National Observatory (KPNO). Even as we were cleaning up KPNO and the DESI instrument in August 2022, we knew that it would possibly be several months before the Tohono O’odham Utility Authority (TOUA) could replace the infrastructure bringing electrical power and line internet (a fiber-optic link) to KPNO. In fact, line internet was not restored until December 7, 2022, almost exactly six months after the start of the fire.
The story of restoring electrical power and the generators used while restoration was in progress is definitely worth telling, and far more lengthy and detailed than the story I’d like to tell now, recovering from the missing internet connection.
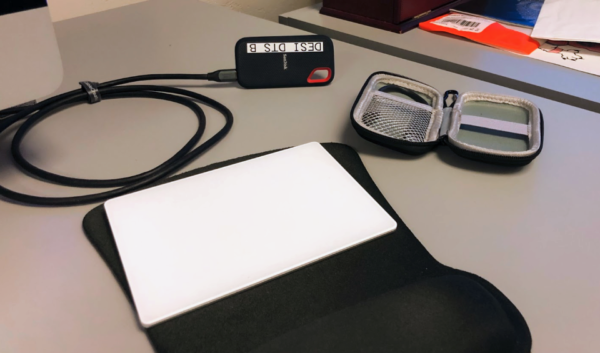
The DESI Data Management team, working closely with the on-site NOIRLab personnel, developed a plan to work around the missing internet, even as DESI returned to full-night operations. It wasn’t a new plan; in fact, it was a very old plan: “Sneakernet”. The idea is that a human being (presumably wearing sneakers) can hand-carry data on physical media from one location to another, and in certain circumstances, the effective bandwidth of that transfer can be much, much higher than the bandwidth of an internet connection or other communication channel. This is actually even more true now than it was in the past, because the storage density of physical media has experienced exponential growth similar to that of Moore’s law for CPU performance. However, while Moore’s law has been showing signs of reaching fundamental physical limits, storage density trends continue to rise.
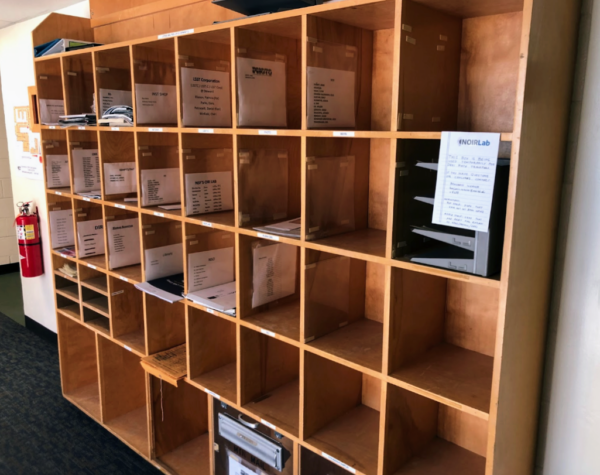
With that in mind, we purchased six 2 TB SanDisk solid-state drives (SSDs), and a few fast USB cables. There is nothing exotic about the hardware; these items would be available in many consumer electronics or department stores. Then with the 6 disks initially carried to KPNO, we would place an entire night of data (or sometimes several nights) on a SSD. One of the personnel working at KPNO would be designated to carry the SSD to Tucson at the end of the work day. Then we would pick up the disk either in person or from a drop box and copy the data to NERSC where it could be processed with the usual DESI data pipeline. Since we purchased six SSDs, that meant we always had several SSDs on standby at KPNO in case an already-transferred SSD could not be brought back from Tucson to KPNO the next day. On weekends, no one would be available to carry the SSDs, so we simply had several nights on Monday evening’s SSD. From the point of view of the pipeline, the only difference was that an entire night (or several nights) would arrive all at once, after a delay of 1 to 3 days, instead of the normal operations procedure of one exposure at a time, almost immediately after the exposure is completed.
The DESI instrument resumed taking data starting with night 20220825 (August 25, 2022). The first SSD was brought to Tucson on September 2, 2022. This process continued until line internet was restored on December 7, 2022. The original data transfer system was ready to go at that point and was reactivated almost immediately after line internet was restored. Thus the last night of data transferred by sneakernet was 20221206 (December 6, 2022). In total, 16,726 exposures over 100(!) nights were hand-carried to Tucson. This amounts to 6.1 TB of data.
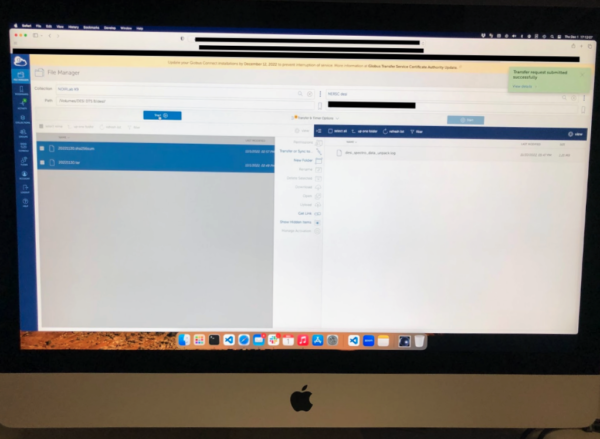
The bandwidth of hand-carried SSDs is impressive, but so is the bandwidth of modern USB cables. After some experimentation, we discovered that we could transfer data directly from the external SSD to NERSC via Globus Online, with bandwidth performance indistinguishable from the case where the data were first copied to a workstation, then transferred via Globus. In other words, the limiting bandwidth was the internet itself between Tucson and NERSC, not the internal systems of the receiving workstation.
While we were transferring DESI data with a very old system (but with the latest SSDs), we were also experimenting with a new one: Starlink. In fact there were at least two separate Starlink installations active at KPNO during the recovery. One, which we’ll call the “DESI Starlink”, was a strictly limited command and control channel for use by instrument experts. The DESI Starlink was not used for any significant data transfer. The other, which we’ll call the “NOIRLab Starlink” was used for more general access to all of KPNO. We did use the NOIRLab Starlink for some data transfer, with mixed results.
At least currently, Starlink works best with a point-to-point style networking connection, optimized for individuals or residences, much like a residential cable modem. Since the uplink bandwidth is currently a factor of 10-20 times slower than the downlink bandwidth, it is less practically suited as a two-way connection between two substantially-sized networks, such as between KPNO and the Tucson base facilities. This manifested as a significant, recurring routing problem. Although bandwidth was adequate for interactive use and for the transfer of small data files, the connection was frequently not working and the routing systems had to be monitored constantly. Nevertheless, we were able to use the NOIRLab Starlink to maintain an off-site copy of the DESI operations database. This copy would have been impractical to maintain using daily SSD transfers, because the copy is a real-time mirror of a live database; it is more of a stream than a set of files. There were occasions where the database mirror fell behind due to interruptions in the Starlink connection. In these cases files created by the database were transferred manually on the SSDs and then once in Tucson the data files were manually added to the database mirror.
It was interesting and a good experience to transfer data over sneakernet. It was also a lot of work and hours. I want to give credit to a big team who all contributed to this effort: Keith Blaine, Paul Demmer, Matthew Evatt, Steve Grandi, Bob Marshall, Rod Rutland, David Sprayberry, Christopher Stone, Bob Stupak (NOIRLab), Martin Landriau (LBNL), and Klaus Honscheid (OSU). Here’s one job we hope we never have to do again!
January 18, 2023
The all-sky camera on the Mayall telescope were the DESI instrument is located provides a view of the entire sky above Kitt Peak National Observatory. This camera helps observers monitor weather conditions and visibility, and confirm when it is safe to open the dome above the telescope. While the skies above Kitt Peak are very often clear, that is not always the case, as shown below in a series of camera images from the night of September 23, 2022. The night began with clouds and rain, and for over an hour flashes of lightning lit up both the sky and the camera view. Finally, toward the end of the night the storm gave way to thin clouds that allowed some stars to peek through. The final frame shows the Milky Way stretched across a mostly clear sky before the series starts over.
Credit: Luke Tyas
The all-sky camera can also capture celestial events, like the lunar eclipse that occurred on the night of November 8, 2022. DESI Lead Observer Luke Tyas created the timelapse below of the eclipse from 108 individual images from the all-sky camera. At first the full moon shines brightly just right of center, reflecting so much light into the sky that only a few bright stars are visible. As the eclipse begins the moon dims to a red dot scarcely brighter than the brightest stars, and the Milky Way can be seen following the eclipsed moon across the sky. As it nears the western horizon the moon emerges from the Earth’s eclipsing shadow, re-illuminating the telescope domes visible on the horizon and washing out the Milky Way.
Credit: Luke Tyas
What is your position or role in the DESI project?
I’m a postdoc at Berkeley Lab since 2019. I have been involved in DESI since 2016 while I was a graduate student at University of Pittsburgh. I have worked on various aspects of DESI, including target selection, survey operations, and the DESI imaging surveys. I enjoy working on the interface between observation and theory, turning the data from the telescope into data and measurements that theorists can compare their models against. The day-to-day work involves a lot of programming, sometimes detective work to figure out what is causing issues in the data, and occasionally writing up the work into papers.
What is the most interesting or exciting thing about your job?
While working on the DESI imaging surveys, I would often examine the data quality by scrolling over images in the Legacy Surveys Viewer, and I’m always fascinated by how vast and beautiful our universe is. And I’m still amazed by the fact that, by mapping out these tiny (and seemingly random and chaotic) blobs of light on the night sky, we are learning something fundamental about our universe. And just as gratifying is being able to work with and learn from this great team of people that are so knowledgeable, enthusiastic, and kind.
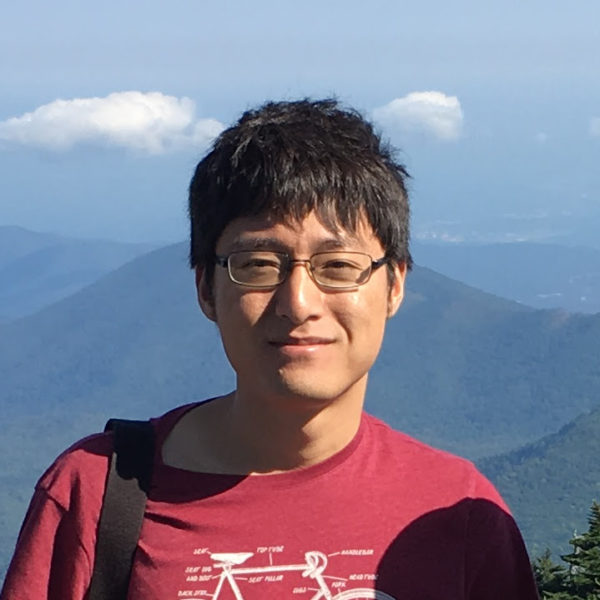
Where were you born? And where do you live now?
I was born and grew up in Chongqing, China, also known as the “mountain city” and “city of fog” and was China’s provisional capital during WWII. It’s famous for its “mala” (literally numbing and spicy) food such as the hot pot. I went to school in Chongqing and the neighboring city of Chengdu, before coming to the US for my PhD degree. I currently live in the San Francisco Bay Area.
What do you do for fun?
I enjoy hiking, cycling, swimming, tennis, badminton, reading, cooking, listening to podcasts, learning new things on youtube, and casual photography.
If you weren’t a scientist, what would be your dream job?
It’s hard to imagine not being an academic of some sort. But if I were not a physicist, a few interesting careers come to mind, in no particular order: biologist/geneticist, geologist, historian, or economist.
Any advice for an aspiring scientist?
Do what you love. One of the best decisions in my life is switching to doing astronomy in the middle of graduate school when I knew barely anything about astronomy or cosmology, and turning a hobby (amateur astronomy) into a career.
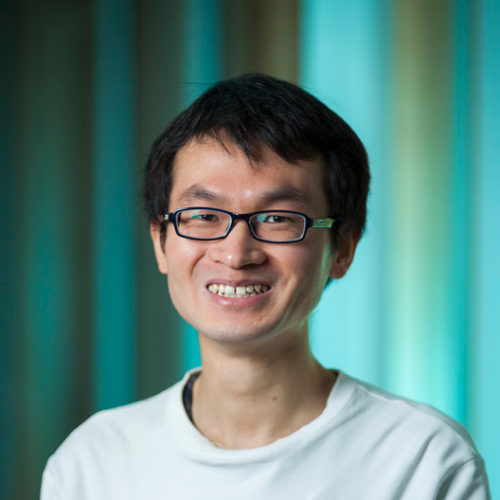
What is your position or role in the DESI project?
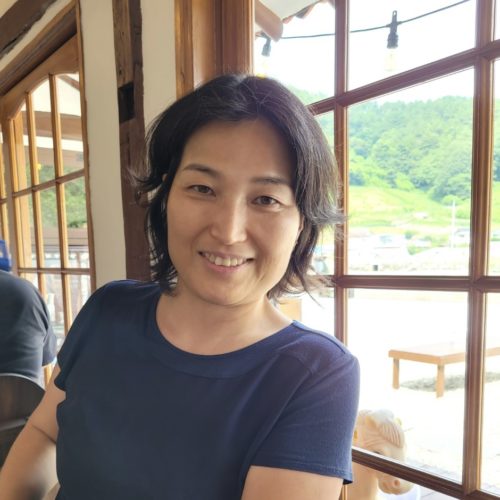
I am postdoc researcher in the DESI C3 and clustering working groups.
Where were you born?
China
Where do you live now?
South Korea
What do you do as part of DESI?
Cosmology, larger-scale-structure, peculiar velocities, HOD, and mock sampling algorithms.
What is the most interesting or exciting thing about your job?
I developed a new HOD model for HI galaxies. I also expect this model can be used to model DESI emission line galaxies (ELGs).
Any advice for an aspiring scientist?
Have a global perspective.
What do you do for fun?
Video games.
If you weren’t a scientist, what would be your dream job?
Travel around the world.
What excites/interests you most about DESI?
DESI providing a larger working group and data set for my research.
 What is your position or role in the DESI project?
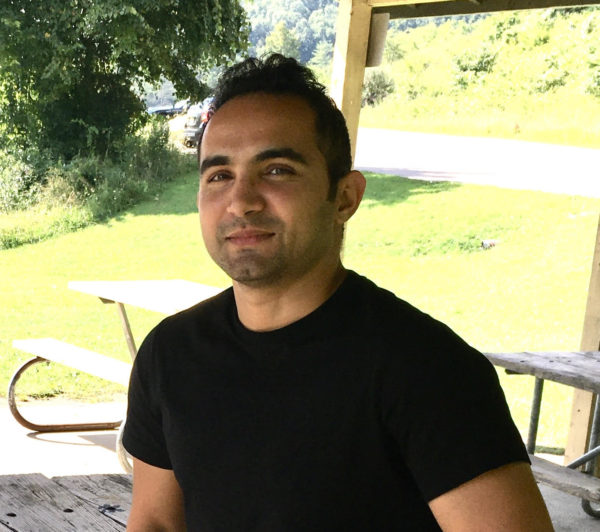
I am a postdoctoral researcher at Kansas State University. Working closely with the Galaxy and Quasar Clustering, Target Selection, and Imaging Validation working groups, my role has centered around the characterization of observational systematic effects since 2016.
Where were you born and where do you live now?
I was born in Hamaden, a city in the midwest part of Iran. I spent a few years away from home for college, before coming to the states to pursue a PhD degree in Physics at Ohio University. I live in Columbus, Ohio now.
What do you do as part of DESI?
I develop methods and codes based on statistics and machine learning to remove the effects of observational systematics, such as those caused by Milky Way extinction. The objective is to enable robust and unbiased measurements of cosmological parameters.
What is the most interesting or exciting thing about your job?
The most interesting aspect about my job is that I get to collaborate with so many talented scientists from all over the world, and this opportunity has enhanced the caliber of my research in many ways.
Any advice for an aspiring scientist?
Learn computer programming and never be afraid to sign yourself up for new challenges; presentations, observations, or public outreach.
What do you do for fun?
I do love cooking for myself, playing pool with friends. I also like racing but unfortunately, I cannot afford a super car at the moment.
If you weren’t a scientist, what would be your dream job?
As a kid, I was curious about the mechanics of automobiles. I even considered choosing Mechanical Engineering as my major in College. If I had not pursued physics, I would have loved to become a mechanic, like Carrol Shelby, building an engine.
What excites/interests you most about DESI?
DESI is one-of-a-kind collaboration which is going to revolutionize modern cosmology in the 2020s. I am really excited about the massive amount of data and all the science that DESI provides and enables.
 What is your position or role in the DESI project?
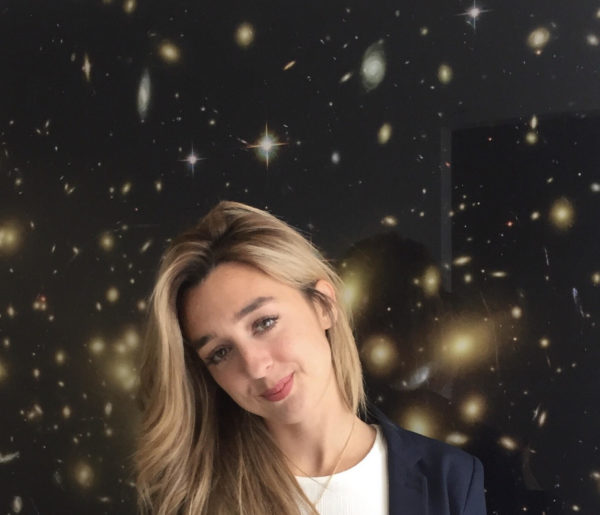
I am part of the lead author group preparing the C3 lensing mock challenge, and in particular, I am leading the effort to calibrate the source redshift distribution of the weak lensing catalogues using the technique of “clustering redshifts”.
Where were you born?
I was born in Italy, in the snowy Alps. I then moved to Milan when I was 10 years old.
Where do you live now?
In 2018 I moved to Australia, and I now live between Melbourne and Brisbane.
What do you do as part of DESI?
My research goal is to investigate possible modifications to the current theory of gravity (General Relativity). From an observational viewpoint, these modifications can be tested by measuring the relative effect of gravity on light (that is, on relativistic particles) and on matter (that is, on galaxy positions). My plan is to combine the three-dimensional distribution of galaxies mapped by DESI with the weak lensing measurements provided by surveys such as the Dark Energy Survey (DES).
What is the most interesting or exciting thing about your job?
There are different aspects I enjoy of my job. In general, I love spending time learning new skills and deepening my knowledge on various topics.
Any advice for an aspiring scientist?
Be curious and find good mentors!
What do you do for fun?
I am a very active person. I love the ocean and the mountains. I enjoy surfing, hiking, op-shopping, visiting art galleries and baking. I miss the snow very much. I started skiing when I was two years old and won my first gold medal at the age of six.
If you weren’t a scientist, what would be your dream job?
I always wanted to be a journalist or a writer. I love art and literature, especially Italian literature. When I was 17 I started working for a local newspaper, but then quit to study physics two years later.
What excites/interests you most about DESI?
At the moment, I am very excited to see what dark questions we will be answering with the upcoming DESI data!
Lawrence Berkeley National Laboratory, 7 October 2022
What is your position or role in the DESI project?
I am a member of the Data Management team with primary responsibility for data transfer and archiving. This includes the transfer of raw data from Kitt Peak to NERSC, as well as transfers and backups of reduced data.
Where were you born?
Dayton, Ohio, USA.
Where do you live now?
Tucson, Arizona, USA.
What do you do as part of DESI?
The role of data archiving requires very careful thought about how data will be accessed and used by the collaboration and the general public. In order to maximize utility and minimize potential confusion, strict quality standards need to be applied to data, code and documentation. Many of these quality standards can be enforced by automation, and I also advise other collaborators on simple ways they can ensure quality from the outset.
What is the most interesting or exciting thing about your job?
I would say on-mountain observing, but that hasn’t been possible for a very long time. That’s unfortunate because the experience of actually working at (in?) a telescope is valuable as well as exciting. Another interesting aspect is following developments in the wider fields of supercomputing, storage, programming and other advanced information technology fields, and sharing that experience with NOIRLab and DESI.
Any advice for an aspiring scientist?
Travel. The current state of affairs is just a phase, and society will realize the importance of travel again. For now, pay for it yourself if you have to, but get out there into the whole world. You can’t taste the food over Zoom.
What do you do for fun?
Hiking, biking, reading, running, enjoying the cuisine of Tucson, a World City of Gastronomy.
If you weren’t a scientist, what would be your dream job?
Cocktail mixologist.
What excites/interests you most about DESI?
DESI is building on the success of a great team of scientists and engineers, many of whom worked for the Sloan Digital Sky Survey (SDSS). It is always a privilege and a pleasant experience to continue working with this team. Considering the astonishing breadth of results from SDSS, the scientific possibilities of DESI are mind-blowing.
 What is your position or role in the DESI project?
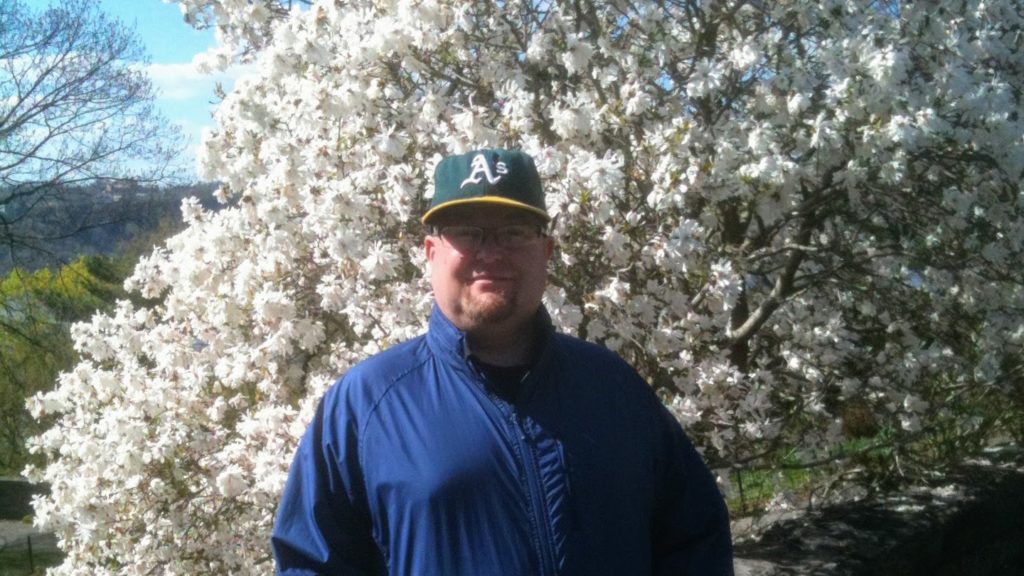
I am currently a co-convener of the DESI Year 1 BAO Key Project.
Where were you born?
Busan, South Korea
Where do you live now?
I live in Athens, Ohio, a small college town. This year, though, I am living in Berkeley, California, for my sabbatical leave. I am super excited.
What do you do as part of DESI?
My postdocs, students, and I are members of the galaxy—quasar clustering working group and our focus is on how to better reconstruct the cosmological information in the distribution of the galaxies, part of which has been lost during the evolution of the Universe for the last 13.8 billion years. We are also working on how to best clean up the observational systematics from the data using a deep learning method.
As a co-convener of the Year 1 BAO Key project (aka Key Project 4), I and many KP4 participants together are working on robustly deriving the DESI Year 1 BAO measurement. We expect the first year DESI data alone to produce the best BAO measurement to date, and therefore it requires a much more stringent systematic control than has been ever done.
What is the most interesting or exciting thing about your job?
What can be more exciting than learning about our Universe? 🙂
Any advice for an aspiring scientist?
Do what you like the most (but I am 99.99% sure that whoever reading this already like astrophysics very much). And the postdoc time is the best time (so, keep swimming).
What do you do for fun?
Learning new things such as piano, kick-boxing, and ballet.
If you weren’t a scientist, what would be your dream job?
This job was my dream job. My alternative dream job was a cartoonist (I had good talent on this, except that I could not redraw the same character more than once).
What excites/interests you most about DESI?
This is the best galaxy survey data today and also I very much appreciate and enjoy the collaborative environment of DESI. Working with people across the world to solve a common question brings you some exciting moments from time to time.
Even the smallest of correlations between galaxies and their environment can impact measurements on the largest scales.
Claire Lamman, Harvard University
September 9, 2022
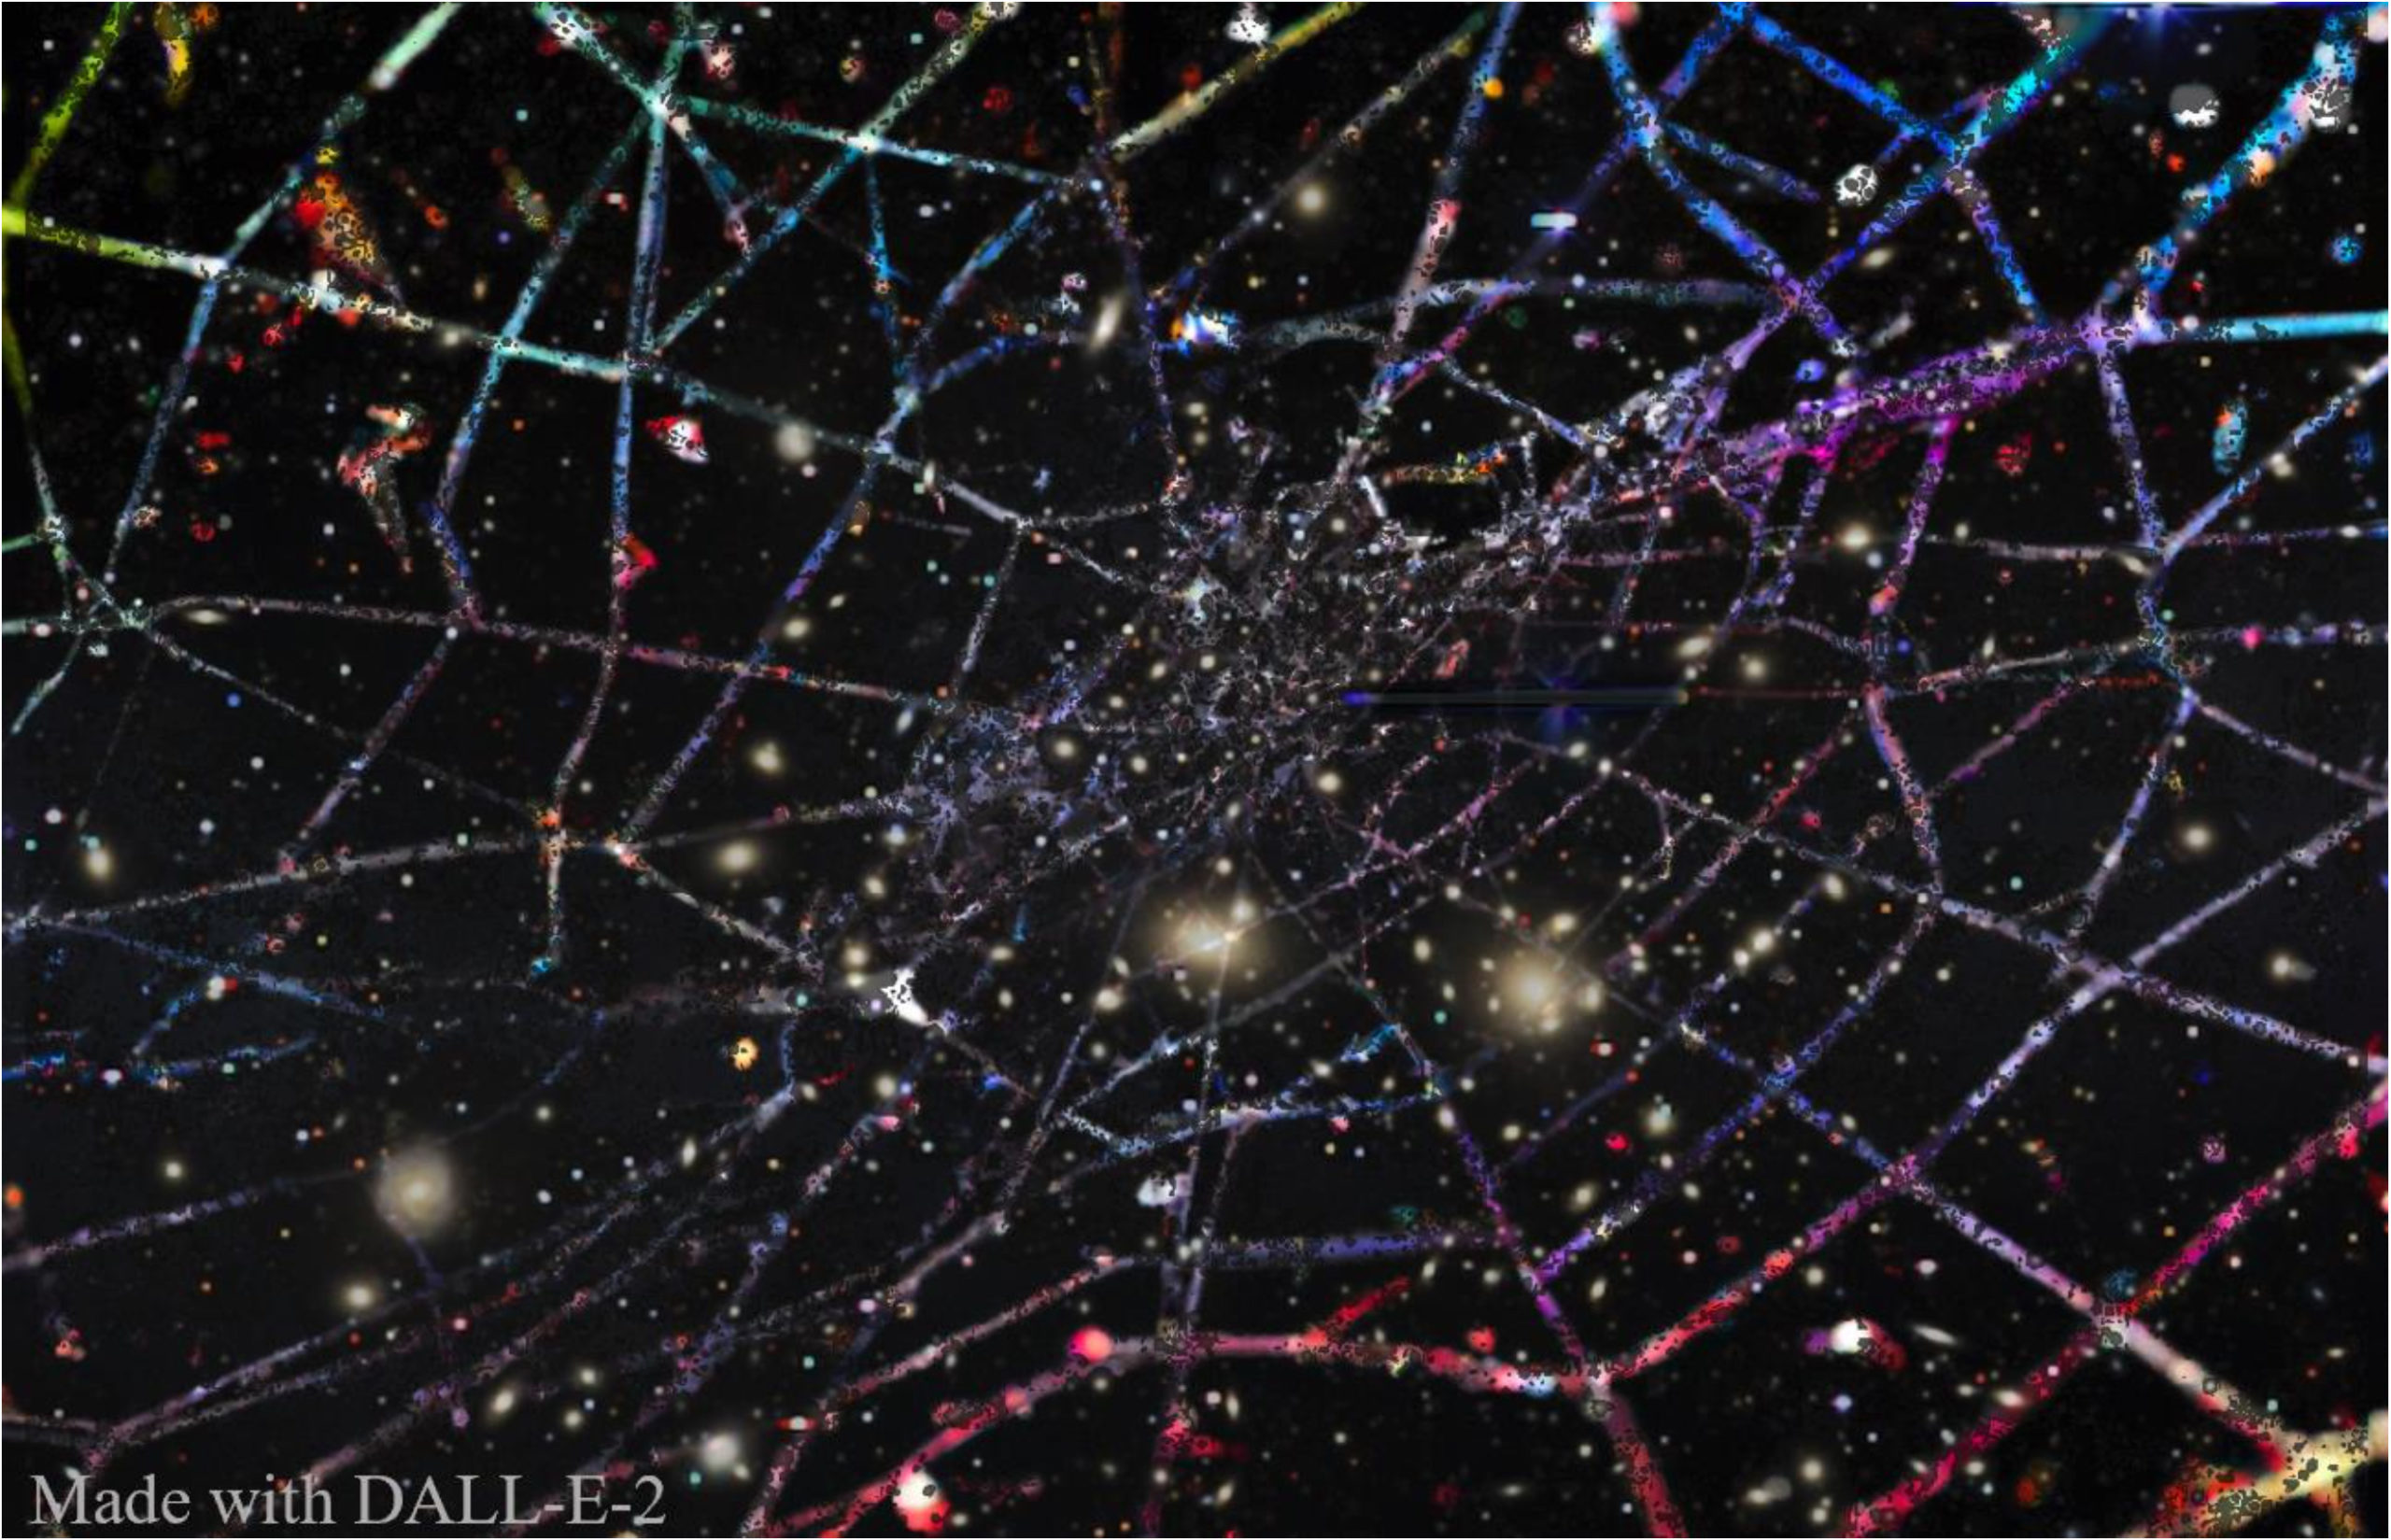 Understanding the largest structures in the Universe and how they evolve is more convoluted than just mapping out the positions of galaxies. This is because galaxy characteristics are not random; they are tangled both with how we choose targets and the underlying cosmic structure that we’re measuring. Interpreting DESI data involves carefully separating these threads, making sure to leave no loose ends.
An important idea to keep in mind is that DESI is not directly measuring the large-scale structure, because it’s mostly dark matter. Instead, we measure “tracers”: galaxies that trace the underlying web. It’s difficult to choose a sample of tracers which perfectly represent the true density. Certain properties of galaxies make them more likely to be observed, and these properties are often correlated with the structure itself. For instance, we’re more likely to observe big, luminous galaxies, which are more likely to be found in dense clusters.
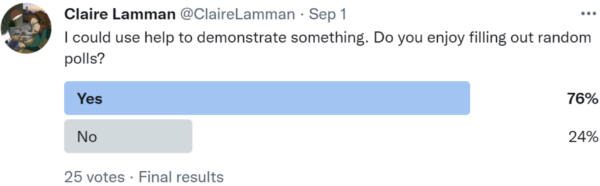
These ideas are not new. Any survey must be careful when their measurement is correlated with the way they select their sample. Here’s a simple example:
The purpose of DESI is to measure out structure very accurately. This means it’s more important than ever to account for even tiny sources of bias, and it can get complicated. Another example is that denser regions have more active galaxies, which can have more distinct spectral lines that make them easier to get redshifts for. Or we can undersample galaxies in dense regions because they are so close together that DESI’s fibers may collide if we observe some at the same time. Yet another example is that we correct for the dust in our own galaxy, but the dust maps we use include a little bit of dust from beyond the Milky Way! This extragalactic dust is more likely to be found in dense regions, so we can end up over-correcting for dust in denser regions and over-estimate their mass.
Each bias must be carefully accounted for. This can be done by comparing our sample to similar surveys or simulations to check for systematic incompleteness. However, many effects must be carefully studied on their own, and there’s enough examples to fill many papers!
I recently finished one such study, about a bias created by the alignment of galaxy shapes. Elliptical galaxies tend to align themselves with density filaments. That is, their shapes stretch along the direction of strands in the cosmic web. This effect is very small, but becomes noticeable when sampling millions of galaxies. This is tied to target selection because DESI is slightly more likely to choose a galaxy that is pointed at Earth; this is the orientation where a galaxy’s light is the most concentrated on the sky. Therefore, we are more likely to observe galaxies which lie in strands that are parallel to our line of sight, and undersample galaxies in density strands stretching across our line of sight.
The contrast in galaxy clustering we measure in one direction versus another tells us how fast the cosmic web forms (Redshift Space Distortions). Galaxy alignments can bias our measurements of this by about 0.5%. Although this seems tiny, it could make the difference between competing models of dark energy. It’s called “precision cosmology” for a reason! Here is a version of my paper written for the general public.
Even small knots like galaxy alignment can tangle up our measurements, which is one reason you need a large team like DESI to unravel the cosmic web.
David Sprayberry, NOIRLab
August 25, 2022
After the Contreras Fire swept over part of Kitt Peak in June, July was devoted to restoring electrical power and water service to the mountaintop. We also carefully assessed every structure for safety, possible fire damage, and the extent of cleaning required. Currently electricity at the summit is provided solely by back-up generators (more on that later). Because the water system lost pressure during the power outage, it was necessary to flush it with chlorine and then fresh water from the storage tanks, and then have the water tested to ensure it meets EPA standards for safe drinking water (it passed!). Work at the telescopes during July was limited to skeleton crews going up for specific tasks to prevent further issues with sensitive scientific equipment. At the Mayall, this included restarting the building’s cooling system, changing filters in the purified dry air system that purges the focal plane enclosure, and changing filters in the HVAC system serving the spectrograph clean room (fondly known as “the Shack”). We also performed regular inspections in all the NOIRLab domes for leaks and electrical faults.
Beginning August 1, telescope staff were allowed to resume almost normal on-site work. At the Mayall we spent the first week cleaning everything we could find a way to reach inside the dome, and any other areas potentially affected by ash or smoke intrusion. The interior of the dome wasn’t particularly dirty, but we cleaned everything thoroughly anyway. We also removed the protective tarp and plastic sheeting from the primary mirror and prime focus corrector, and made a preliminary inspection of the optics, which look fine. During the second week of August we caught up on overdue preventive maintenance of the telescope and dome, and worked to provide a low-bandwidth internet connection to the Mayall.
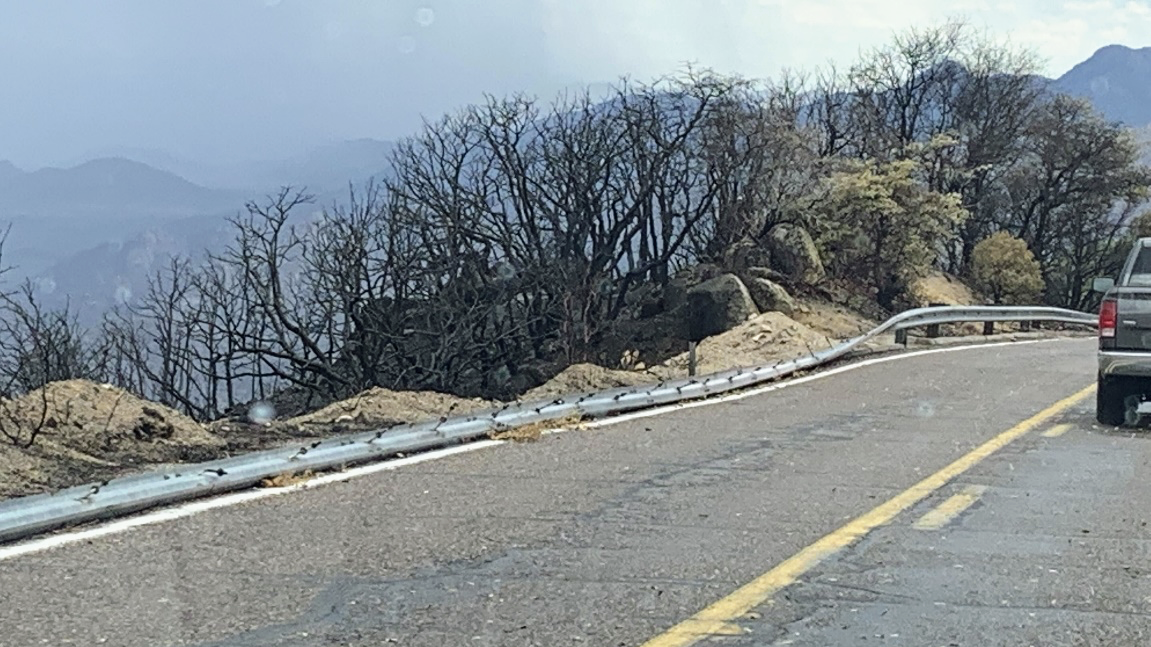
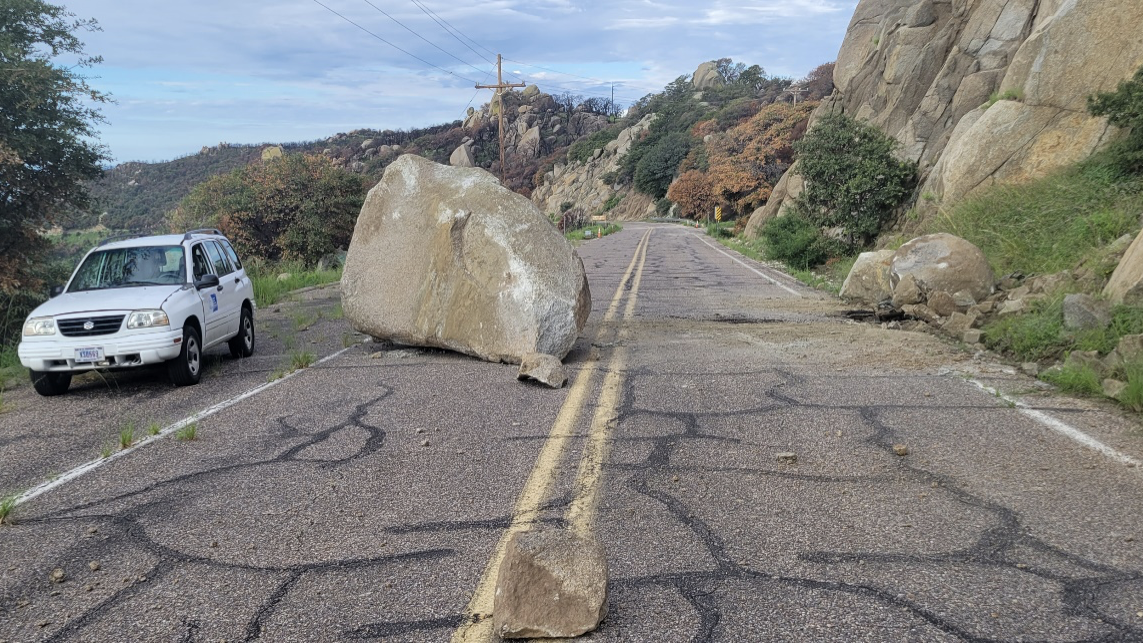
Road Conditions
Throughout August, road and weather conditions have significantly limited the time our team can spend on-site. The fire damaged guardrails along the road, and there has been a lot of erosion from burned areas washing across the road during heavy rains. This extraordinary erosion has clogged many of the drainages that cross the road, sometimes causing impassible mudflows. Additionally, the fire damaged several drainage culverts under the road. The Arizona Department of Transportation (ADOT) is making progress on repairs, but they are hampered by frequent heavy summer “monsoon” thunderstorms since late July. Finally, erosion is worsening the normal amount of rockfall along the road during storms. Combined with this year’s strong, frequent storms, we are encountering more rocks and boulders in the road.
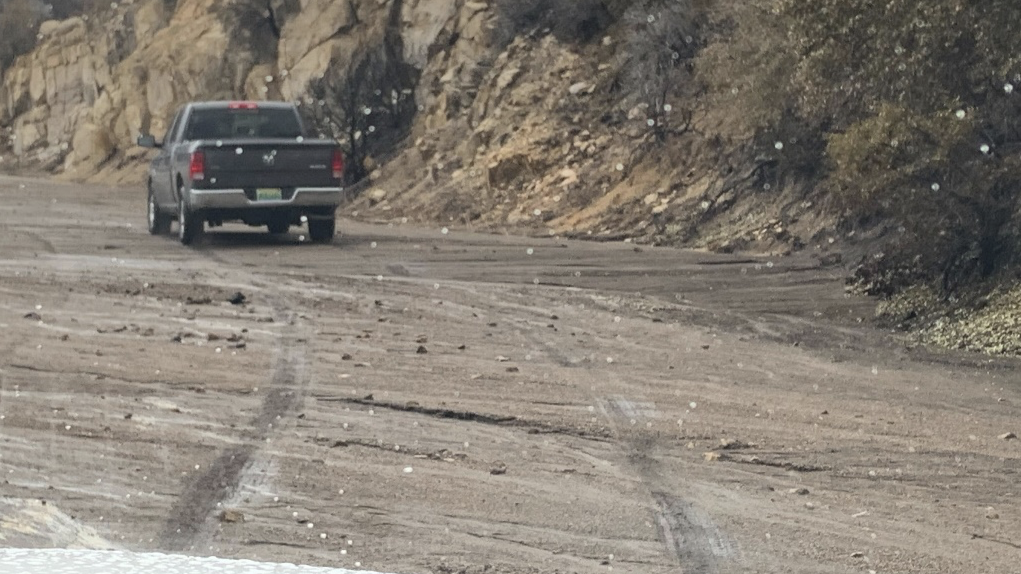
Road restrictions are still in place. Repair work frequently requires closing both lanes, and so that we interfere as little as possible ADOT requires us to go up and down the mountain in one convoy at the same times every morning and afternoon, weather permitting. NOIRLab is also concerned for site safety due to the possibility of road closures caused by mudflows or rockfall. Whenever rain begins or is threatening, everyone on the site ceases work, makes their work site safe, and assembles for departure in an early convoy.
Electrical Power and Internet
The fire damaged between 10 and 20 utility poles that bring electricity and fiber optic data to the summit. Our utility provider, the Tohono O’odam Utility Authority (TOUA), is working hard to replace the damaged poles, but they face a number of obstacles. Many of the poles are in very remote locations. Other lines and poles elsewhere on Tribal lands were also damaged by storms. And like everyone else TOUA is grappling with supply chain disruptions. It will be at least several weeks until power is restored, and then fiber optic lines will be replaced.
The observatory is currently powered by on-site backup generators. One serves the Mayall and adjacent University of Arizona buildings, and another serves the rest of the mountaintop. This is expensive in terms of refueling needs, and leaves the site without back-up power sources if one of the generators were to fail. We are in the process of renting additional generators and connecting them to use as primary power sources. Once this is done the permanent back-up generators can return to back-up status.
Keeping the generators fueled is a challenge. Not all vendors will deliver diesel fuel to our remote site. Recently our normal supplier was unable to make our regular delivery when their truck broke down, and the Mayall generator ran out of fuel before an alternate supplier could reach the summit. Storms and road conditions further complicate the situation.
For temporary internet service DESI has obtained a Starlink system and service for the Mayall. The equipment is installed and connected to one network switch in the Mayall building, but that connection requires a standalone DNS server in the Mayall to allow normal access to the many other computers and switches in the building. DNS within NOIRLab is normally provided by one central server in Tucson, but that is obviously not an option right now, so work is underway to construct this standalone DNS system.
Optics Cleaning
We want to clean both the primary mirror and front surface of the prime focus corrector with carbon dioxide “snow”, and do a wet wash of the primary mirror. However, these operations require a relative humidity of < 50%, sustained through the day, to prevent condensation after the “snow” cleanings and promote drying after the wet wash. We haven’t seen a relative humidity reading that low since the August 1 return to the summit. DESI very much wants the optics cleaned before going back on-sky, as relative throughput measurements using the guide cameras are the first tests called for. We’re waiting for the first relatively dry day to seize an opportunity for optics cleaning.
Restarting DESI
Restart of the DESI equipment can’t really begin until some internet connectivity is restored and remote monitoring of the equipment’s health is possible. The expected order of events is to re-establish a fully-functioning network with internet connectivity; then bring the DESI computer cluster back on line; and then change filters inside the focal plane cooling system, restart focal plane cooling, and test basic focal plane and fiber view camera functions.
Once the focal plane guiders are running we can perform a simple throughput test if the optics have been cleaned and observing conditions are good. The next major phase will be restoring spectrograph operations. This involves restarting the cryostat control systems, pumping down cryostats, turning on the cryocoolers, and waiting for the CCDs to reach working temperature. The spectrograph restarts do not depend on weather conditions, but we do need a back-up electrical power supply or to know that one is on the way, so we don’t risk another unplanned warm-up were the back-up generator to fail.
We don’t yet have a firm timeline for restarting DESI, as so much depends on the weather and other things we have little or no ability to control. We’re doing the best we can, and will continue to post updates as developments warrant.