Edmond Chaussidon, CEA Saclay
January 12, 2022
Although DESI will be able to collect 5,000 spectra simultaneously, galaxies are still too numerous to be all observed during the next five years of observation. Target Selection (TS) is a crucial step to identify which objects to observe during the spectroscopic survey.
To constrain the cosmic expansion history through measurements of Baryon Acoustic Oscillations, DESI probes the matter in the Universe with four different tracers:
- Bright galaxies (BGS) in the redshift (z) range 0.05 < z < 0.4
- Luminous Red Galaxies (LRG) for 0.4 < z < 1.0
- Emission Line Galaxies (ELG) for 0.6 < z < 1.6
- Quasars (QSO) for 0.9 < z < 2.1
Quasars will also probe the Universe at higher redshift (z > 2.1) through Lyman-alpha forest studies measuring the light absorption by the gas in front of quasars.
Easy to say that we want to select different galaxy types, but how? The main information we need are the galaxy colors, which we can determine thanks to the measurements provided by photometric surveys. We used the catalogs of the DESI Legacy Imaging Surveys, a program conducted over more than 14,000 square degrees of sky from the Northern hemisphere, in three optical bands: g (in the blue-green), r (in the red), and z (in the red/near-infrared, and not to be confused with redshift!). The data were collected via three independent programs:
- The Beijing–Arizona Sky Survey (BASS) observed ∼5,100 square degrees of the North Galactic Cap (NGC) in g and r using the 2.3-meter Bok Telescope.
- The Mayall z-band Legacy Survey (MzLS) provided z-band observations over the same footprint as BASS using the 4-meter Mayall Telescope.
- The Dark Energy Camera Legacy Survey (DECaLS) was performed with the Dark Energy Camera (DECam) on the 4-meter Blanco Telescope. DECaLS observed the bulk of the Legacy Imaging Surveys footprint in g, r, and z.
These optical data were complemented by two infrared bands from the all-sky data of the WISE satellite, namely: W1 (3.4 μm) and W2 (4.6 μm).
The selection of the BGSs, LRGs and ELGs was mostly done based on conditions on the source colors. For the QSOs, however, which are harder to select because their colors are quite similar to those of the overwhelming stellar background, we developed a more complex approach based on machine learning. To further reduce the contamination of the sample from unwanted stars or galaxies, we applied an additional constraint on source magnitude. All these conditions were tuned on previous spectroscopic samples as those from the BOSS/eBOSS program. But of course, we also intensively tested them during the Survey Validation (SV) phases emulating a nominal observation with DESI. Voilà! Lo and behold, they all give very satisfying results.
DESI is now on sky, observing every night the quasars and the galaxies that we selected using these algorithms, on its way to build the largest 3D map of the Universe to date!
The Target Selection and Survey Validation steps are described in great detail in the upcoming eight scientific papers (one Overview, two for the SV, four for the TS and one for the Milky Way Survey). Pipeline and algorithms for data reductions and operations will be described in another set of five scientific papers later. So, stay tuned!
For the curious, below are more details on how we proceed for the four classes of targets, and some information about the density of objects we thus select.
Bright Galaxy Target Selection
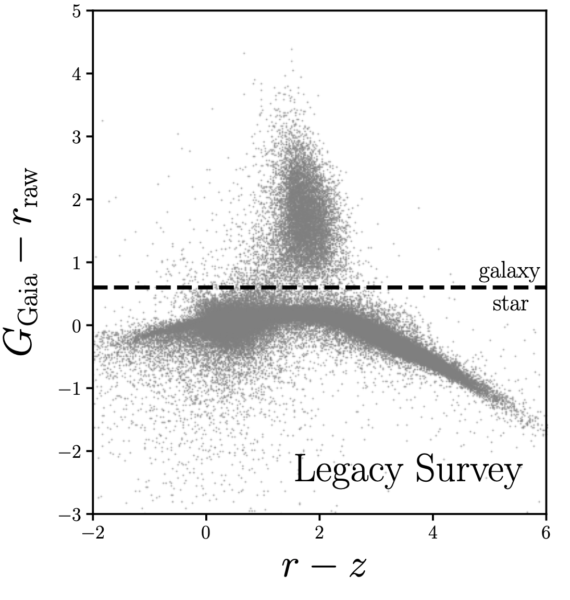
Star–galaxy separation in BGS is performed using a GGaia – rraw cut. This criterion exploits the fact that the Gaia magnitude is measured with an aperture of a space-based point-spread function (PSF) while the Legacy Imaging Surveys magnitude captures the light from the entire source. This cut separates point sources (stars) from extended sources (galaxies). This selection will observe ~850 targets per square degree. (See Hahn et al., in prep.)
Luminous Red Galaxy Target Selection
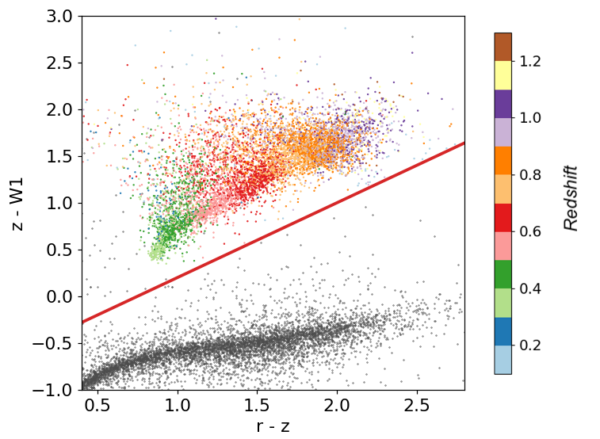
 LRG selection is done by the cut (red line) in the (r – z) – (z – W1) space. This selection uses the W1 infrared band to separate galaxies (color points) from stars (grey points). The different colors show the redshift of the galaxies in the color–color space. This selection will observe ~615 targets per square degree. (See Zou et al., in prep.)
Emission Line Galaxy Target Selection
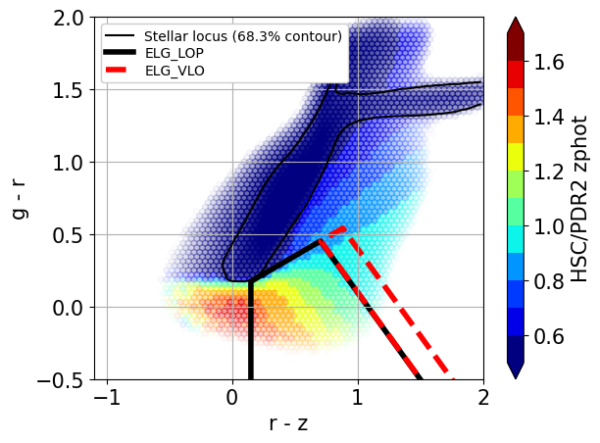
 To avoid stellar contamination (black smooth line) in the target selection, ELG selection uses a cut in (r – z) – (g – r) space. The color histogram is the redshift distribution of ELGs in the color space. This selection will observe ~2,387 targets per square degree. (See Raichoor et al., in prep.)
Quasar Target Selection
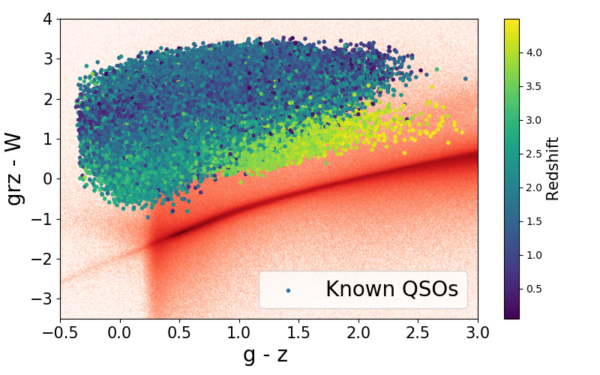
 Only point sources are considered during the selection and the target selection aims to separate quasars from stars. However, the separation between these two classes is less obvious than in the previous cases. A more sophisticated selection has to be applied. Quasars are selected via a Random Forest classification instead of the classical color cuts selection done in previous spectroscopic surveys. The idea of the selection is to separate quasars from stars based on the “infrared excess” of QSOs. The stellar locus is illustrated by the red line and the quasars by the blue/green/yellow points. This selection will observe ~308 targets per square degree (see Chaussidon et al., in prep.).

