• Skip to main content
  • Skip to primary sidebar
  • Skip to footer

Dark Energy Spectroscopic Instrument (DESI)

  • / science /
    • science overview
    • cosmology and dark energy
    • redshifts and distance
    • mapping the universe
    • the DESI science mission
    • the DESI survey
    • imaging surveys
  • / instrument /
    • instrument overview
    • telescope
      • tohono o’odham
    • corrector
    • focal plane system
    • fiber system
    • spectrograph
    • instrument control system
    • data systems
    • bringing DESI to life
      • commissioning Instrument
      • protoDESI
  • / collaboration /
    • DESI team
    • DESI builders
    • collaborating institutions
    • sponsors
    • code of conduct
    • vendors
    • collaboration policies
  • / press /
    • announcements
    • in the news
    • press releases
    • tweets by desisurvey
    • blog
    • acknowledgments
  • / galleries /
    • videos
    • image gallery
  • / for scientists /
    • data releases
    • instrument design
    • imaging data
    • target selection and survey validation
    • theory and simulations
    • other DESI science
    • key publications
    • all DESI papers
    • team login
    • request a DESI speaker
    • internal
  • / education & outreach /
    • meet a DESI member
    • blog
    • planetarium show
    • DESI high
    • interactive visualizations
    • DESI Merch

Cosmic cartography

August 19, 2021 by almagonzalez

almagonzalez

Claire Lamman, Harvard University
August 20, 2021

For many, the term “explorers” brings to mind long ocean voyages, adventurers plunging into jungles, and traders discovering new connections between continents. Exploring, as a profession, became obsolete as there were simply no large, unexplored regions left and Earth became thoroughly mapped out.

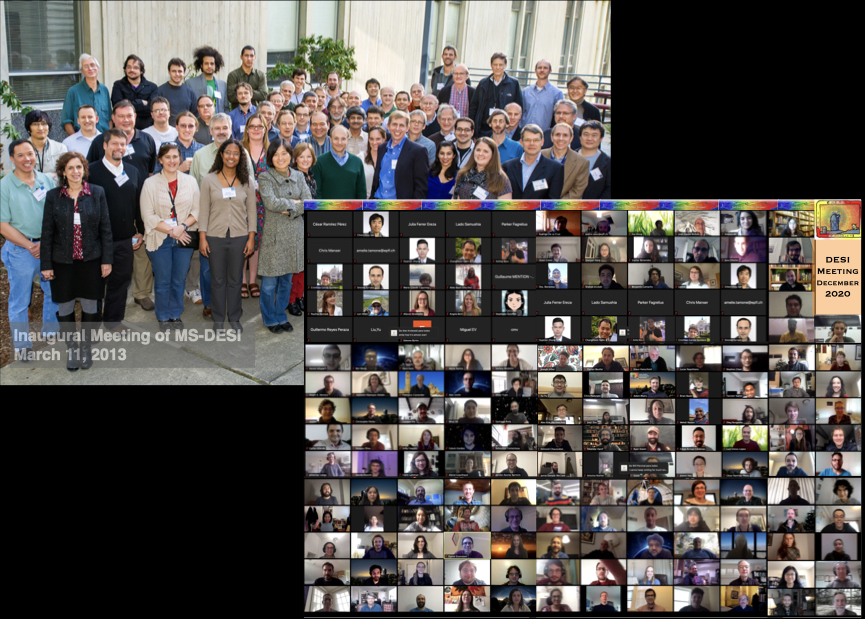
However, there are still many uncharted regions beyond our planet. Hundreds of modern-day explorers are mapping out the galaxies around us, a craft that I like to think of as Cosmic Cartography. Fortunately for us, there’s not as much scurvy and snakes involved, but there is a massive effort behind today’s surveys and cosmology comes with its own set of adventures. 

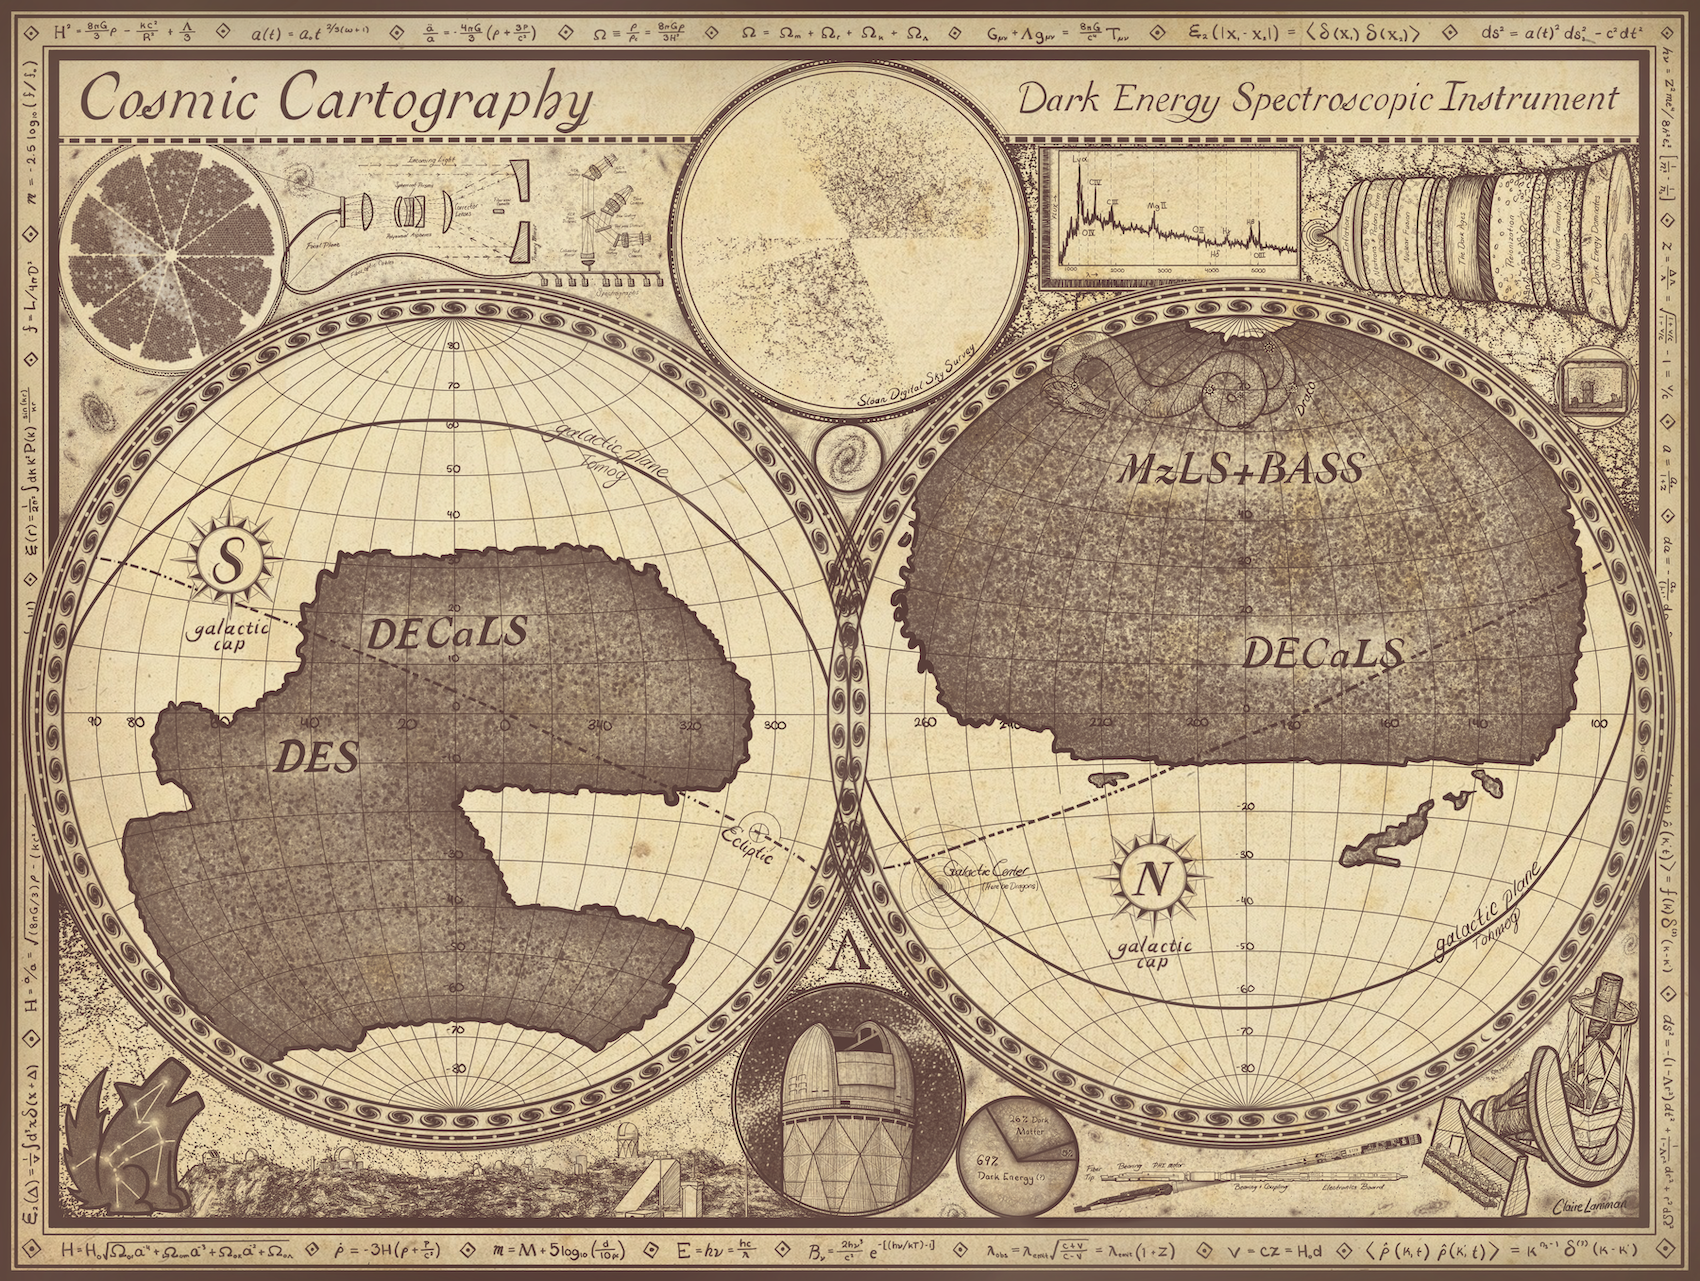
DESI is creating the most detailed map yet of nearby galaxies. To celebrate the connection between early terrestrial and early cosmic explorers, I’ve made this DESI art in the style of early world maps. Here is a guide to some of the details:

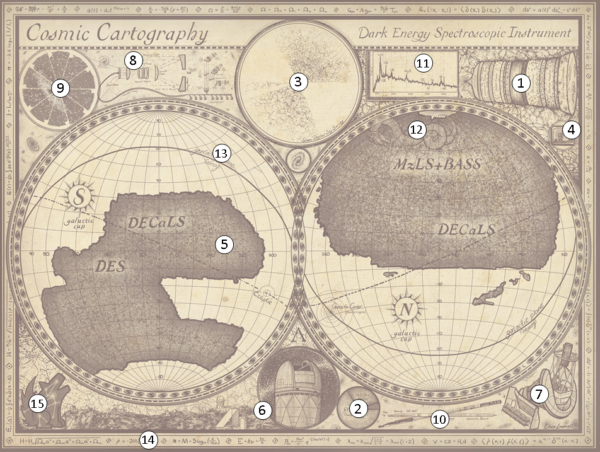
  1. A history of our universe. Since the big bang, our universe went through many changes as matter formed and eventually made stars, galaxies, and us. To understand how these changes happen, and how fast the universe is growing, we need to understand what it’s made of.
  2. Pie chart of the universe. From our observations, we know that normal matter (the stuff that stars, dust, you, and I are made of) only accounts for about 5% of content in universe. 26% is dark matter- matter we cannot see but can study through how its gravity affects the normal matter and light around it. The other 69% is dark energy. As far as we know, about the only thing it has in common with dark matter is a spooky name. Dark energy is the mysterious force we credit with the rapid expansion of the cosmos. For more information see this blog post.
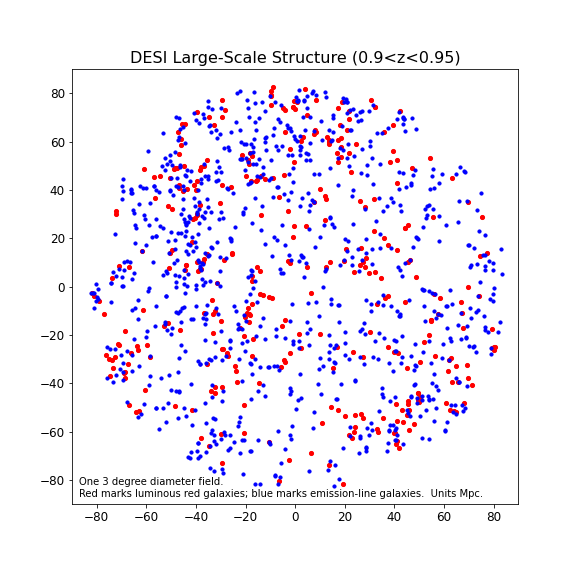
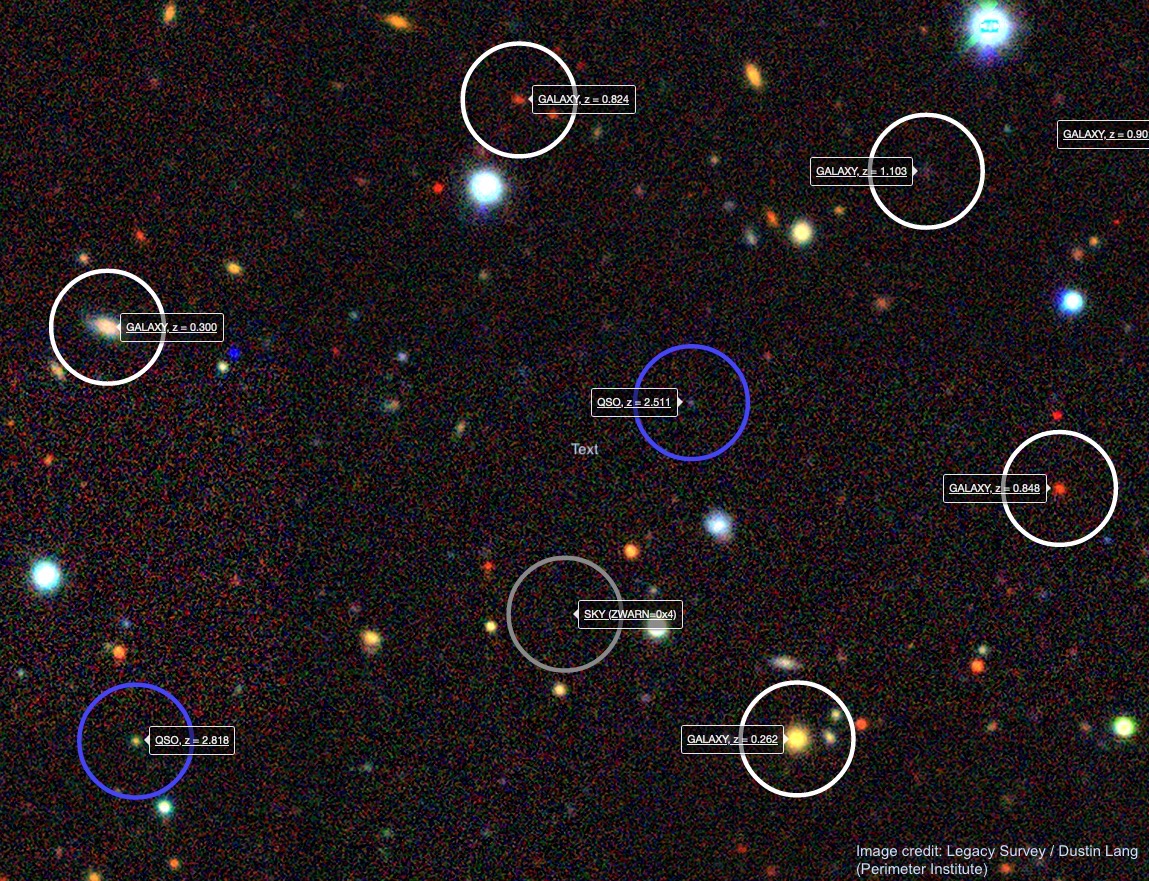
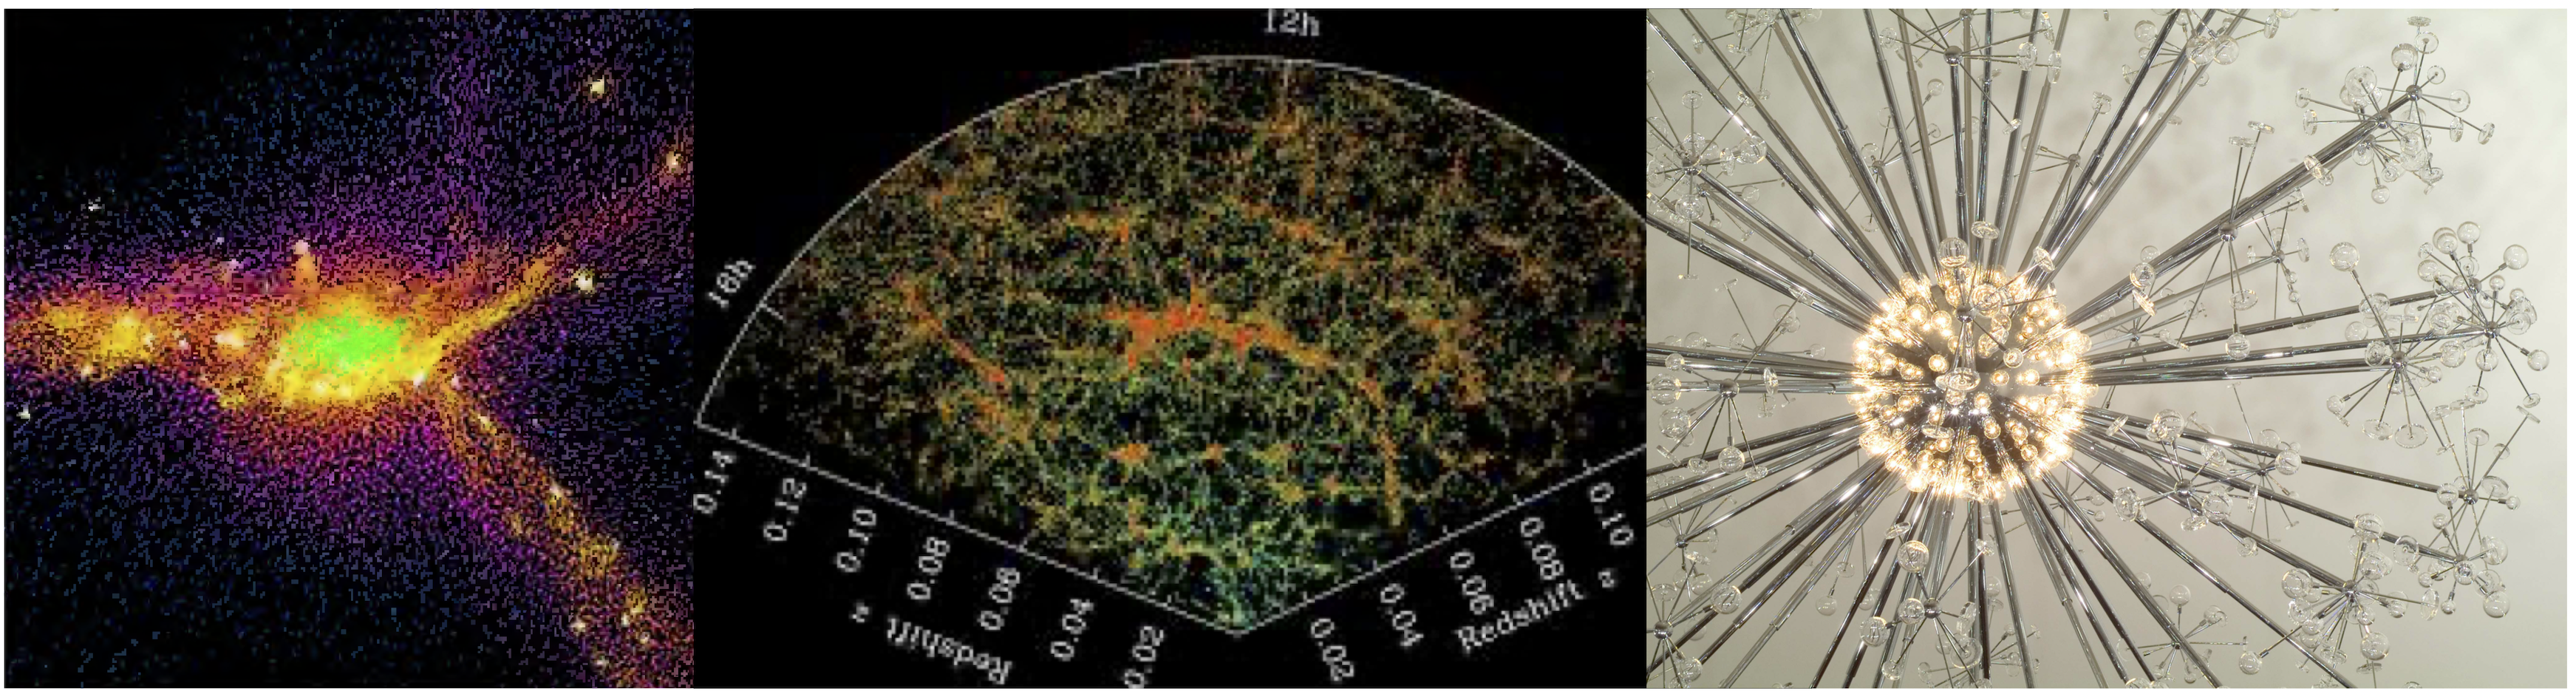
  3. Time Map. Light takes time to travel. The light we see from nearby galaxies is relatively young, but from older galaxies it comes from a much older universe. Therefore, we can get a glimpse at what the universe looked like at different times by mapping it out near and far away. This is the map made by the Sloan Digital Sky Survey (SDSS) of galaxies around us. Earth is at the center. It looks like an hourglass because those are the galaxies in the part of the sky where SDSS was measuring. If you look closely, you may be able to see some structure – in places with the most data you can pick out a sponge or web pattern.
  4. DESI. This is our logo. Our mission is to make a more detailed map so we can explore some of the remaining questions about dark energy and the evolution of the universe.
  5. The DESI Footprint. This map shows the parts of the sky where DESI is looking. We call it the “footprint”. One chunk is south of the Milky Way (left) and one is north of it (right). DESI has already picked out the 30 million galaxies that we will measure. For more information see this blog post.
  6. DESI’s home. DESI is located on a mountaintop in Arizona, Kitt Peak (left). It’s part of the biggest telescope on the mountain, the Mayall (right).
  7. The Telescope. This is what lies under the dome – a massive structure supporting a 15-ton primary mirror, fine-tuned optics, a focal plane, and a separate room filled with spectrographs. More on all of this below.
  8. How it works. This is a simplified diagram of the telescope. First, light hits the primary mirror. It then reflects up into a series of lenses before hitting the focal plane. The focal plane is a disk of 5,000 robotic positioners, each able to gather the light of their own galaxy. The light from each robot is then sent via fiber optic cables to spectrographs, which measure the light so we can get a spectra for each galaxy (11).
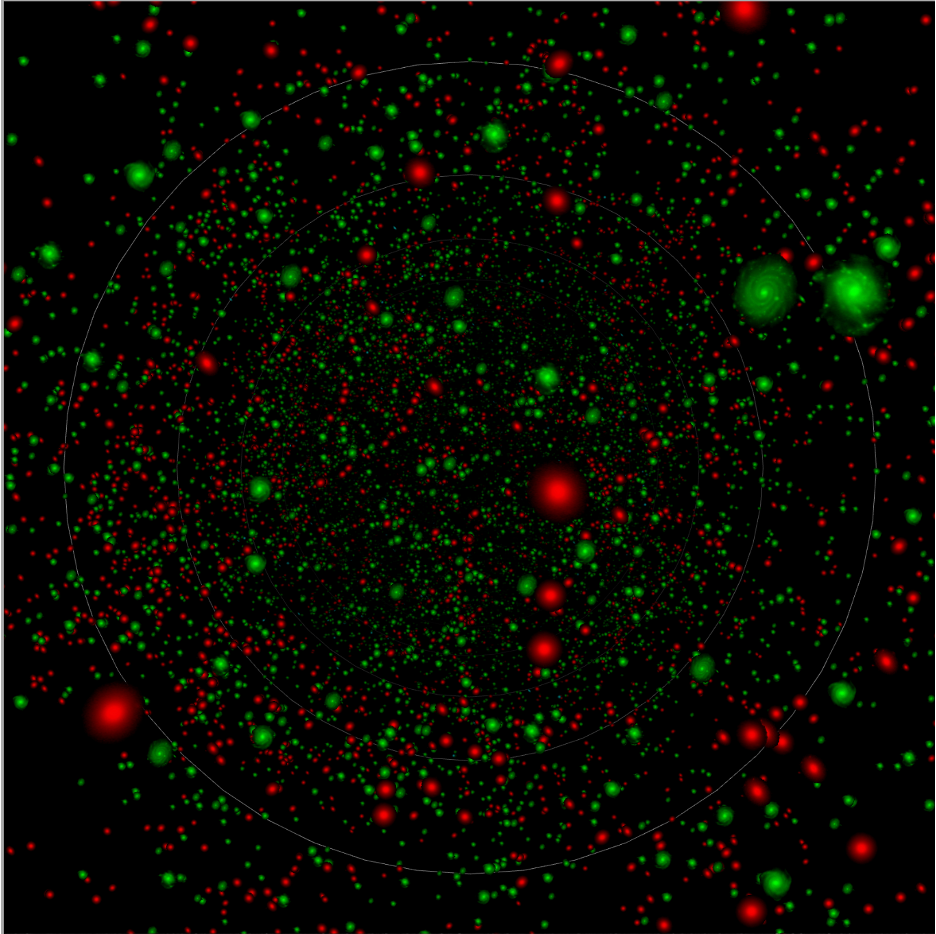
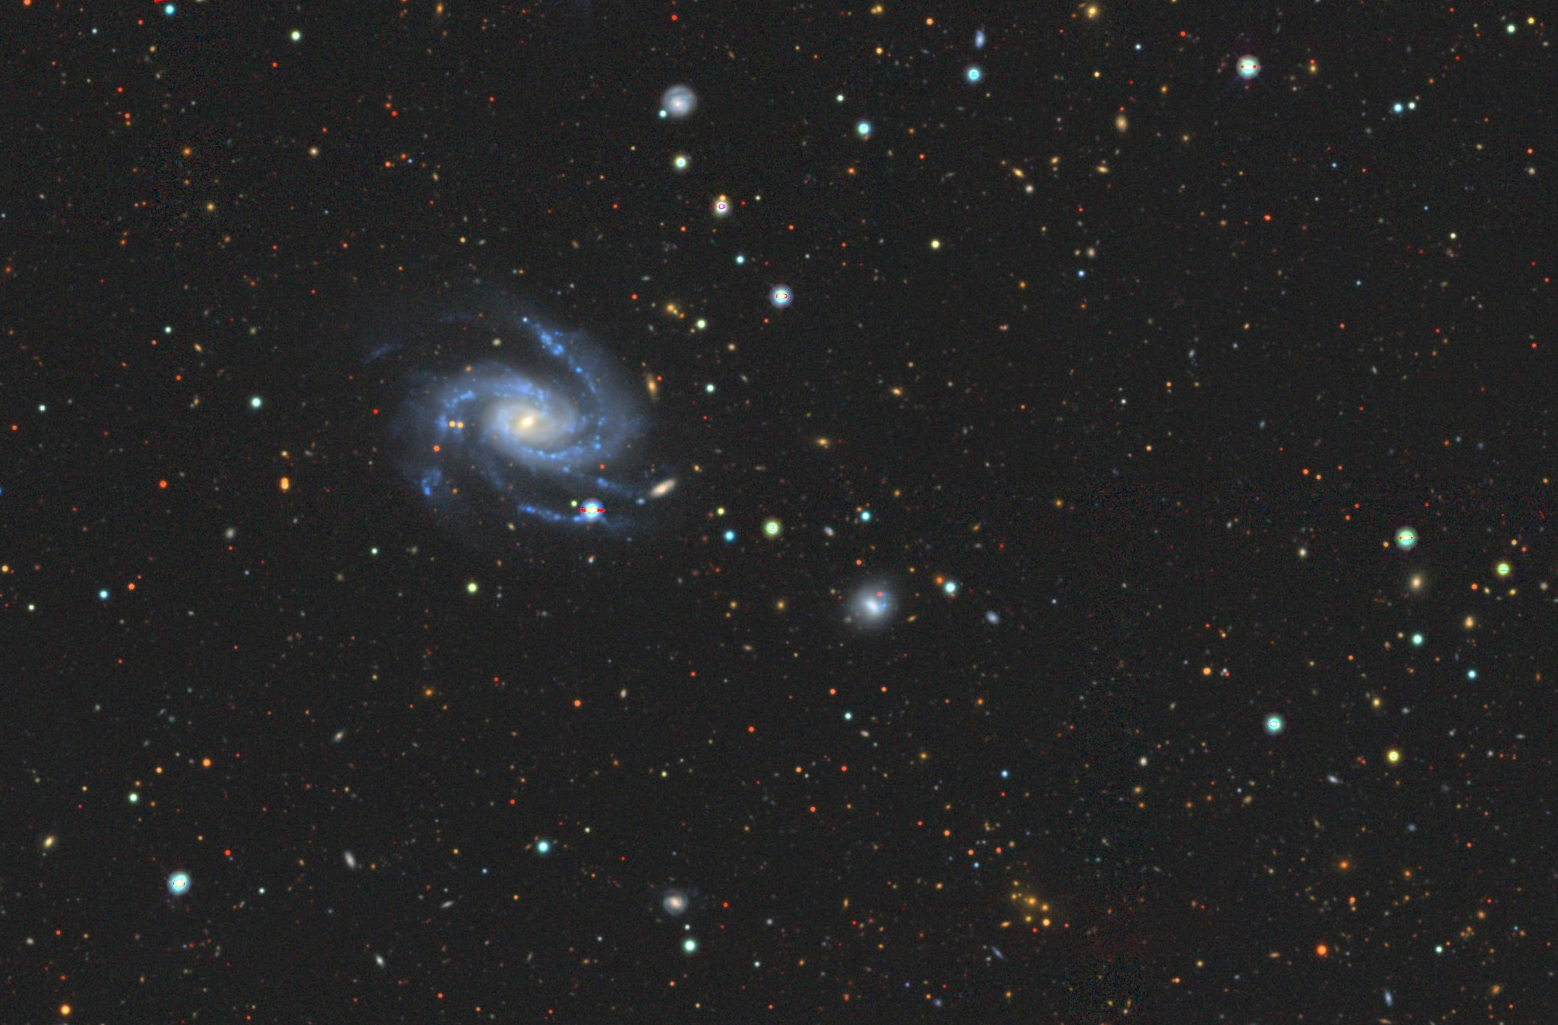
  9. The focal plane. We often plot the values of each positioner, as they’re positioned on the focal plane. This is a drawing of what we saw when the telescope pointed at Andromeda. This galaxy takes up the perfect amount of sky so that we have a “picture” of it just by looking at positioner values. The other galaxies are far enough away that each gets its own positioner.
  10. The positioners. Here is a diagram of what one of the robotic positioners looks like, with a drawing of one in the background.
  11. Spectra. This is the type of measurement we want to get of every galaxy. Light from a galaxy contains many signals, coded in the amount of light that is present for different amounts of energy. When you plot the intensity of light as a function of energy (or wavelength) you see something like this. This is the spectra of a quasar, a brilliant type of galaxy with a very active black hole at its center. We expect to see certain peaks at certain energy levels. These shift based on the galaxy’s movement and allow us to measure its distance. For more information see this blog post.

More details

  1. Draco. Star locations and art of the constellation Draco. You can’t have an old map without a serpent!
  2. Tomog. Tomog is the Oʼodham word for the Milky Way. The Tohono O’odham people are native to Kitt Peak and the land surrounding it.
  3. Cosmic Linguistics. These equations help astronomers describe and study cosmology. They express everything from how further objects look dimmer to how different components of the universe affect its evolution.
  4. DESI Dog. Our beloved mascot, the DESI coyote, with the constellation Canis major, or “the big dog”.

Filed Under: blog, feature on homepage

Bela Abolfathi, University of California Irvine
June 1, 2021

On May 17, DESI officially began a 5-year survey of the cosmos to study dark energy and its role in the accelerated expansion of the universe. Over the course of its survey, DESI will collect spectra from over 30 million galaxies across 11 billion years, a feat that will result in the largest 3D map of the universe ever created.

Prof. David Kirkby at UC Irvine created an interactive 3D visualization that helps put into perspective exactly how ambitious of an undertaking this is. The visualization linked to the image below shows around 30,000 galaxies observed during the survey validation phase—less than 0.1% of the galaxies DESI will eventually catalog—jam-packed into the space behind your palm held at arm’s length.

Try the interactive version here (credit: David Kirkby/DESI collaboration)

Each of the four types of galaxies specifically targeted by DESI are denoted by a separate color and correspond to bright galaxies (BGS), luminous red galaxies (LRG), emission-line galaxies (ELG), and quasars (QSO). These types populate different redshift regimes, as seen from the progression of colors over the course of the movie. That’s not to say that types are confined to select regions of redshift-space. Rather, they are targeted in this way because, once they’ve been redshifted to our telescope, their unique signatures fall into the 360-980 nanometer window registered by our detectors. In the case of high-redshift quasars, these objects are selected because they help reveal the distribution of matter in the intergalactic medium via the shadows they cast along their journey.

Like the opening crawl at the beginning of every Star Wars movie, the visualization starts in the nearby universe and takes us back in time to distances far, far away. Exactly how do we determine these distances? We start with each galaxy’s redshift, which we can measure from its observed spectrum. Both the composition and curvature of the universe will determine how fast it’s expanding, and by extension any notion of distance. We therefore need to assume a particular cosmological model in order to then transform from redshift to comoving distance.

The visualization defaults to using the fiducial values of 31% matter, 69% dark energy, and zero curvature. Changing these parameters will have a noticeable effect on the distance traveled as well as the age of the universe.

One of DESI’s main cosmological probes is baryon acoustic oscillations (BAO), the imprints of relic sound waves from the early universe. BAO is a standard ruler used to measure the scale at which galaxies tend to cluster. The concentric circles emanating from the center of the 3D visualization show the comoving 150 Mpc BAO scale at which we expect galaxies to cluster slightly more often compared to a random distribution of galaxies.

Filed Under: blog, feature on homepage

After completing its Commissioning and Survey Validation phase, on May 17 the Dark Energy Spectroscopic Instrument (DESI) officially entered into “a five-year quest to map the universe and unravel the mysteries of ‘dark energy’“.

The video below shows about 30 thousand of the first galaxies measured by DESI, only a small fraction of the tens of millions of galaxies and other distant objects in the universe that will allow the DESI collaboration to construct a detailed 3D map of the universe. See the Press Release and related blog posts.

credit: David Kirkby/DESI collaboration

Filed Under: announcements

Fermilab News, 17 May 2021

Filed Under: in the news

Lawrence Berkeley National Laboratory, 17 May 2021

Filed Under: press releases

Michael Levi, DESI Director
May 14, 2021

On the eve of the official start of the DESI science survey, I wanted to take a minute to reflect on how we arrived at this exciting moment. We’ve now proven that we can obtain 100,000 science-quality spectra in a single night, so we are ready! It has been quite a long and at times bumpy road to get here, but it has always been an honor to be part of this team. Of course, the ground was prepared by SDSS-BOSS, which established BAO as a precision probe of dark energy and created a desire to go beyond plug-plates. The seeds of this project germinated in 2008 out of the DOE/NASA JDEM space mission competition, when Saul Perlmutter and I were co-PI’s of the SNAP/JDEM proposal. The competing JDEM concepts led to the realization that a lot of the proposed BAO science could be performed from the ground, and this in turn led very quickly to a new concept for a ground-based spectroscopic survey. A rapid-fire set of ad hoc proposals and public presentations to DOE and NSF agency committees ensued as a core formed around this idea.

At the 2009 Particle Astrophysics Scientific Assessment Group (a subpanel of the NSF/DOE HEPAP Federal Advisory Committee), Nikhil Padmanabhan (then an LBNL Chamberlain Fellow), gave a presentation, which resulted in a recommendation to support the R&D. David Schlegel presented the BigBOSS concept to the 2010 Decadal Survey, which recommended mid-scale projects, explicitly calling out ground-based spectroscopic surveys as a compelling area of interest. In early 2011, two unsolicited proposals were submitted to DOE, for BigBOSS led by LBNL, and for DESpec a competing concept led by FNAL. This prompted the formation in mid-2011 of a dark energy community planning panel, chaired by Rocky Kolb, to advise the agency. The panel identified a wide-field spectroscopic survey as a key project that would meet the needs of the dark energy community. DOE agreed and, in the year following, approved “Mission Need” (aka CD-0) for a Mid-Scale Dark Energy Spectroscopic Instrument (MS-DESI) on Sept 18, 2012. 

Group photo at the inaugural meeting of MS-DESI 2013 (M. Levi in the center, see original note here) and DESI meeting on December 2020

DOE didn’t make a down-select between BigBOSS and DESpec. Instead, they assigned the management of the new MS-DESI project to Berkeley Lab on Dec 12, 2012 and charged us to form a new collaboration. I was appointed Project Director the next week and given the task to figure it out and come back with a plan. Fortunately, we had just received a $2.1M grant from the Gordon and Betty Moore Foundation for a spectroscopic survey (followed a bit later by a similar grant from the Heising-Simons Foundation) and this provided the financial resources for us to get started building the first spectrograph and initiating the long-lead acquisition of the corrector lenses.  At the same time, we began to hold collaboration meetings and created a “big tent” where all were welcome, and the DESI collaboration grew to include most of the institutions of the original proposals, plus many additional recruits.

A year later, in 2013, I presented the new plan and the newly formed science goals to the Particle Physics Project Prioritization Panel (P5), a subpanel of the NSF/DOE HEPAP Federal Advisory Committee. The P5 report, issued in mid-2014, recommended MS-DESI only in an optimistic budget scenario. Fortunately, budgets did align sufficiently for us to eke out a start in 2015 (albeit financially constrained) with CD-1 approval (site selection, and establishment of cost range) in March 2015 and with Congressional authorization in the appropriations language that year. DESI was then baselined in Sept 2015, construction started, and the rest is history as they say. Although there were plenty of remaining bumps in the road during construction, I will save that for another time.

It is a privilege for me to represent the collaboration and contribute to its continuing success, and I hope all our collaborators feel equally privileged. The DESI collaboration has come together in this common quest to understand dark energy and the mysteries of the accelerating Universe. Now the telescope and instrument are humming, twilight and science awaits.

Filed Under: blog, feature on homepage

Paul Martini, DESI Instrument Scientist
May 17, 2021

The discovery of cosmic acceleration over twenty years ago captured the imagination of the general public and professional scientists alike, and the cause of this acceleration remains one of the greatest, unsolved questions in science. Something mysterious, such as a new particle, a new force of nature, or some property of space itself, is overcoming the gravitational attraction of all of the mass in the universe. While we commonly call the origin of this acceleration ‘dark energy,’ naming it did not solve the mystery, nor have the last two decades of progressively larger and more sophisticated sky surveys. 

Enter the DESI survey. For the last decade, hundreds of scientists and engineers have worked to build a new instrument and design a survey capable of constructing the most precise measurement of cosmic expansion history ever. On Friday, May 14 this work came to fruition with the formal launch of survey observations. And over the next five years, DESI will measure approximately 35 million galaxies and quasars that extend across about 12 billion years of cosmic history. These observations will measure an order of magnitude more targets than the largest survey to date, and complete these observations in a small fraction of the time. 

DESI aims to survey about 14,000 square degrees of the night sky, which corresponds to most of the sky visible from Arizona. We will do this with over 15,000 unique observations that we call tiles. Each of these tiles is a unique configuration of the 5000 robotically-positioned fiber optic cables designed to collect the light of specific galaxies and quasars distributed across the 3.2 degree diameter field of view of the instrument. 

The image below shows a small fraction of this field of view that includes the nearby Coma cluster of galaxies, one of the largest concentrations of galaxies in the local universe. The circles in the bottom panel illustrates the high density of the spectroscopic observations obtained with a single tile. Nearly 10,000 of these tiles are designed for good to great conditions, such as when the Moon does not appreciably affect the darkness of the night sky. In these cases, we observe our faintest targets, including luminous red galaxies, emission-line galaxies, and quasars. The remaining tiles target brighter galaxies and Milky Way stars, sources that can be observed when the moon is brighter and there may be moderate cloud cover.

A small part of the Coma cluster of galaxies (top) with redshifts from DESI added (bottom). This nearby cluster is approximately 300 million light years from Earth and is one of the largest concentrations of galaxies in the local universe. It contains many thousands of galaxies comparable to or larger than our Milky Way in size. Both the large number and high density of redshift measurements is a small sample of how efficiently DESI can measure galaxies.The area of this image is less than 1% of the field of view of DESI. (Credit: DESI collaboration and DESI Legacy Imaging Surveys)

As the DESI survey will be so much larger than previous surveys, we anticipate measuring cosmic acceleration and other parameters with substantially smaller statistical errors. Yet in order to fully realize these gains, and not be limited by systematic effects, it is especially important for us to carefully plan all aspects of the experimental design and maximize the reproducibility of our work. One aspect of this is that we have built substantial software and hardware systems to help us to achieve the same sensitivity with all of our tiles, in spite of the fact that they will be observed on nights spread over five years, and obtained under nights with varying amounts of atmospheric turbulence or seeing, and varying amounts of cloud cover. Other aspects include superb and repeatable algorithms that handle every aspect of observing, ranging from the selection of potential targets, to the assignment of targets to the individual fibers, to the measurement of their properties. 

We have spent the last many months building, testing, and refining all of these aspects of the survey with increasingly sophisticated and extensive observations. During this Survey Validation phase, we have obtained over 1 million unique redshifts, which has already made DESI the second largest spectroscopic redshift survey in the world before it formally begins. Over the coming months, we expect that the number of new galaxies and quasars we measure will continue to expand, much like the universe itself!

Filed Under: blog, feature on homepage

Daniel Eisenstein, Harvard University
April 28, 2021

On April 5, 2021, DESI turned to the final phase of its Survey Validation (SV) work, the so-called “One-Percent Survey”. Whereas the first phase of SV was aimed at getting long and definitive observations of a broad superset of the planned spectroscopic targets, the One-Percent Survey aims to demonstrate that we can operate the facility in a model closely matched to that planned for the 5-year survey.

The 1% survey is being conducted with target selection similar to what is planned for the main survey and with exposure times only mildly longer. Importantly, we aim to observe each region of sky more times than in the main survey so that we achieve a higher fiber-assignment completeness, the fraction of targets that are assigned a fiber.

A single exposure with DESI provides about 600 fibers per square degree, but the survey target lists contain about 3500 targets per square degree for the dark/grey conditions (when the moon is small or set) and about 2000-2500 targets per square degree for bright conditions (when the moon is fuller). In the main survey, we will return to a point on the sky numerous times to observe about 80% of the targets, but allowing some incompleteness so that we can efficiently move on to new regions. In the 1% survey, we plan to return to each region at least 10 times for dark-time targets and 8 times for bright-time targets, each with a distinct target list, so as to observe all but a few percent of the targets.

So far, we have started observations on 16 regions, each 7 square degrees and each including both dark-time and bright-time targets. We expect to finish this program in May. With this data set, we will be able to get a first estimate of the 3-dimensional clustering of the galaxy and quasar samples, which will then allow the collaboration to tune the models of simulated galaxy positions in our cosmological mock catalog.

With the observations moving at normal survey pace from one target set to the next, the rate of gathering new redshifts has increased dramatically. In the first 8 nights, we acquired over 400,000 separate successful redshift measurements of 350,000 unique sources.

DESI Collaboration. Daniel Eisenstein (Harvard University)

The plot shows a visualization of one of the 16 regions, which has 13 dark-time visits, showing a map of the galaxy locations in Mpc on the plane of the sky. Only galaxies between redshift 0.90 and 0.95 are shown, with the luminous red galaxy targets plotted in red and the emission-line galaxy targets in blue. One can see the cosmic web of large-scale structure, with walls, filaments, and voids, as well as the tendency of red galaxies to cluster together more than blue galaxies. This is about 1 part in 20,000 of the final survey size!

Filed Under: blog, feature on homepage

Daniel Eisenstein, Harvard University
April 19, 2021

Since mid-December, DESI has been intensively performing its Survey Validation (SV) observations. With SV, we seek to optimize the 5-year survey design using on-sky observations of our target classes. We of course based our designs on what was known before DESI, but DESI is a big enough step forward that one can’t be sure until one verifies the performance with the instrument itself!

One of the challenges for Survey Validation is that we want to verify our survey plans with targets that are fainter and spread over wider areas of the sky than have previously been observed. So we need to make our own truth tables by observing our targets with much longer exposures than we plan for the survey, so that the correct answers become obvious. We then can split the observations into portions to see what a survey-length exposure would yield. 

A small region from the Dark Energy Camera Legacy Survey (DECaLS), roughly 0.1 degree across, overlaid with redshifts from DESI survey validation spectroscopy. Visible here are representatives from DESI’s major extragalactic targets: two quasars (QSO) beyond redshift 2; luminous red galaxies at redshift 0.8; an emission-line galaxy at redshift 1.1, fainter than r-band magnitude 23; and two brighter galaxies at lower redshift. The grey circle marks the location of a fiber placed on a blank position to monitor the emission from the sky.

From mid-December through the end of March, DESI observed 161 separate tiles as part of the first phase of its survey validation program, collecting over 1600 separate spectroscopic exposures. We combined 4.3 million separate observations of 465,000 distinct examples of our target classes, with an average of 95 minutes per target, obtaining redshifts for 412,000 objects. This is already one of the largest extragalactic spectroscopic data sets ever collected, including 108,000 redshifts above 0.8.

The whole DESI collaboration has mobilized to analyze these on-sky data, because rapid answers are needed to define the main survey. The results have been very encouraging; we’ll share more examples in future blog posts.

Filed Under: blog, feature on homepage

Brian Bauer, Daniel Allspach, and Noah Franz
April 16, 2021

We are a working group of three undergraduate students at Siena College. We started with DESI under Dr. John Moustakas in February 2020. We were intrigued by the opportunity to work with such a large collaboration with so many scientific possibilities. Since then, Noah Franz and Brian Bauer have focused on identifying strong gravitational lenses in DESI spectra by using Python to separate the source and lens galaxy spectra then analyzing the success. Daniel Allspach has been working to fit stellar templates to model DESI spectra continua and determine galactic demographics and outflow classifications. Contributing to these projects has provided us with invaluable insight and experience into working with large collaborations.

Left to right: Noah Franz, Brian Bauer, Daniel Allspach

After working with DESI, attending Zoom telecons, and learning how a collaboration functions, what we enjoyed most of all is the welcoming nature of everyone involved. Without this feeling of acceptance we would have found it difficult to integrate into a project effectively. Although receiving emails in the wee hours of the morning can be a little odd at first, we were able to quickly adapt and become accustomed to the practices and methods employed by DESI. Being included in any aspect of the project, especially as an undergraduate, is an honor, yet we were continually challenged to dive deeper and join as much as we can. A welcoming environment provides the perfect jumping off point for new members and that is truly the best part about the DESI collaboration.

With over 700 contributing members, DESI is a large collaboration, and, as undergraduate researchers we found entering the community of mostly graduate students and PhDs intimidating and overwhelming. While some of the DESI updates and zoom meetings can be daunting, after spending time reading the literature and learning the acronyms we became accustomed to the jargon. Once we surpassed this learning curve, we were able to start our own research projects. In many ways this was our introduction into large scale collaborative astronomy and cosmology: many things are new to us. Having the DESI environment to help us orient and navigate this research environment has been incredibly helpful. DESI has given us a fantastic first experience not just with research but also working with a large collaboration. As a result, we all were inspired to continue research going into the future.

Filed Under: blog, feature on homepage

Education and Public Outreach committee collaborators (Shanthala Gorur, Michael Wilson, Alma González, and many others)
March 8, 2021

To commemorate the 2021 International day of Women, March 8th, we wanted to highlight and show the work of the many women working in DESI.

We asked the women in DESI to share with us their advise for the new generations to come, and the work they are doing in DESI.

We start this post with a collage from the pictures and a small selection of the responses.

This post will continue with some more of the particular responses, on twitter, stay tuned.

SPANISH VERSION

Filed Under: blog, feature on homepage

John Moustakas, Siena College
February 3, 2021

In its quest to uncover the mysteries of dark energy, DESI will measure precise redshifts for more than 15 million emission-line galaxies or “ELGs.” Although they are incredibly distant and faint, DESI will take advantage of a distinctive feature in the light emitted by these galaxies—a feature called the “oxygen two doublet”, represented by the symbol “[OII]”.

But what is this so-called doublet and where does it come from? And why oxygen? To answer these questions we need to dig into some astrophysics!

Did you know that after hydrogen and helium, oxygen is by far the most abundant element in the universe? For example, in our solar system there are one-and-a-half times more oxygen atoms than carbon atoms and nearly twenty times more oxygen atoms than iron atoms! Because it is so common, oxygen is also an incredibly important element in galaxies, especially in the gas between stars, what astronomers call the “interstellar medium.” In fact, oxygen is one of the primary ways for galaxies to “cool down.”

Let’s take a quick look at what this means. In galaxies, new stars generally form at the centers of cold, dense clouds of gas and dust. Occasionally, a very massive star will be born—a hot, bright star which can be anywhere from two to one hundred times more massive than the Sun. These monster stars pump enormous amounts of high-energy photons (i.e., light) into the surrounding gas, stripping away the electrons which are normally bound to atoms and creating a spectacular “soup” of fast-moving electrons, protons, and positively charged heavier atoms like oxygen surrounding the new star. Astronomers call these vibrant, short-lived sites of activity in galaxies “HII regions” or “star-forming regions”.

30 Doradus Across the Spectrum (Credit: Q. Daniel Wang (NWU), UM/CTIO, UIT, ROSAT.)

Now, the typical temperature of these star-forming regions is a balmy 10,000 degrees Kelvin, hotter than the surface of the Sun! So how does the region get rid of this extra energy and cool down? Well, as atoms like oxygen whip around in random directions, they will occasionally crash into one another. When this happens, some of the kinetic energy of motion goes into “exciting” one of the atom’s electrons into a higher energy state. But the electron doesn’t stay excited very long!

After about a second, the excited electron spontaneously “jumps down” to a lower energy level, simultaneously emitting a photon of energy (i.e., light) in the process. Subsequently, this photon escapes from the star-forming region, robbing it of the original energy pumped in by the hot young star and helping it cool down. In the actively star-forming emission-line galaxies which DESI is hunting, we observe oxygen “shining” in this way at two close but distinct energies or wavelengths, 372.71 and 372.98 nanometers. (One nanometer is one billionth of a meter, so the wavelength of this light is about 170 times smaller than the width of human hair!)

This pair of lines is called the “oxygen two doublet” (the “two” confusingly means that the oxygen atom is missing one electron) and it is written using the symbol “[O II].” In December 2020, DESI began observations as part of its “Survey Validation” phase, and one important question this phase aims to answer is, “How efficiently will DESI be able to pre-select (or “target”) emission-line galaxies?” So far, the answer to this question has been a resounding, “Really well!” To illustrate the kind of tremendous data DESI is obtaining, Dr. Julien Guy of Lawrence Berkeley National Lab has created an animation of the [OII] doublet in a sample of roughly 3400 emission-line galaxies which DESI observed in December, a tiny fraction of the more than 35 million galaxies DESI will observe during its 5-year survey.


Credit: DESI Collaboration

This movie shows the strikingly clear [OII] doublet in these galaxies, which brings DESI one step closer to being able to uncover the mystery of dark energy.

Filed Under: blog, feature on homepage

Jeremy Tinker and Zheng Zheng
January 19, 2021

DESI member and noted rapper David Weinberg, from Ohio State University, was awarded the Dannie Heineman Prize for Astrophysics. He shares the award with Robert Lupton of Princeton University. The award celebrates the massive contributions both researchers have made to ushering in the era of large-scale three-dimensional mapping of the universe through the spatial distribution of the galaxies within it, primarily through their work with the Sloan Digital Sky Survey (SDSS).

As a project, DESI owes a debt of gratitude to SDSS. SDSS was the first truly large-scale galaxy redshift survey, using a CCD camera and fiber-fed spectrographs. With first light in 2000, its goal— realized in 2007 with the completion of SDSS-II— was to map nearly a quarter of sky by obtaining distances (redshifts) of the million brightest galaxies and quasars in the universe. In late 1980s, when the SDSS was merely an idea being batted around the Paris Conference Room of the Chicago O’Hare Hilton, David was a graduate student at Princeton, working with SDSS’s visionary founder Jim Gunn. He both literally and figuratively got started on the ground floor of large-scale spectroscopic surveys.

From left to right: (a) An image of the gas distribution around a nascent galaxy forming in a supercomputer simulation, taken from the paper “How Do Galaxies Get Their Gas?” (b) The map of the Main Galaxy Survey of the SDSS, color-coded by the stellar age of each galaxy (image created by Mike Blanton). (c) The Last Scattering Surface, by Josiah McElheny, with scientific consulting by David Weinberg.

David became a full SDSS member in 1992, and went on to serve as the Scientific Spokesperson for SDSS-II, a position that demands a myriad of critical tasks related to the design, organization, promotion, and execution of the project. When the SDSS-III collaboration was created in 2008, David was chosen to be the Project Scientist. In recent years David has brought his expertise to the DESI collaboration, being one of the chief architects of the Bright Galaxy Survey component of the project as well as serving as the inaugural BGS working group co-chair. 

While a member of SDSS, David made invaluable contributions to survey design, galaxy target selection, and eventual analysis of the maps of cosmic structure. David was an early adopter and developer of the halo occupation model to describe the distribution of galaxies in space, who introduced the now commonly used term Halo Occupation Distribution (HOD). The model relates galaxies to clumps (halos) in the matter distribution in the universe. The SDSS data led to the pioneering application of the HOD framework to interpret the clustering of galaxies in space, with clustering trend naturally explained and galaxy-halo connection informatively inferred. The HOD model has ever since been widely adopted to analyze galaxy clustering data, becoming a powerful tool in learning about galaxy formation and cosmology and in creating simulated galaxy catalogs for various purposes in large galaxy surveys. 

In addition to mapping the universe with galaxies, David was also a pioneer in a novel method of determining the matter distribution of the universe: the Lyman-alpha forest. This method uses bright quasars as cosmological flashlights. Cool gas along the pathway to our telescopes absorbs some of the quasars’ light, leaving wiggles (Lyman-alpha forest) in the quasar spectra. Such wiggles reveal the spatial distribution of cool gas, which tracks dark matter. Thus, the spectra of quasars taken in SDSS and in DESI provide complementary maps of cosmic structure. 

As a scientist, David wears many hats in addition to survey astronomy. He has produced highly influential work on hydrodynamical simulations of galaxy formation, he has worked on the life cycles of active galactic nuclei, and more recently he has used SDSS’s spectra of stars to perform “chemical cartography” within our own Milky Way Galaxy. His 169-page review article on “Observational Probes of Cosmic Acceleration”, with nearly 900 citations, has become the standard reference in guiding our observational efforts toward revealing the nature of cosmic acceleration.

In addition to his research-oriented scientific pursuits, David has a long-standing collaboration with the MacArthur Award winning sculptor Josiah McElheny. Together, they have created cosmologically-inspired glass sculptures that have been exhibited all over the world. David’s role is in making the designs representative of the physics of the universe. For example, the piece An End to Modernity depicts the history of the universe from the Big Bang to the present day, emphasizing the evolution of cosmic structure and the epoch of galaxy formation.

Since starting at Ohio State in 1995, David has been advisor and mentor to 17 graduate students. Many of his former students, including the two of us, are themselves members of SDSS and DESI, and are using these data to mentor and train their own students, drawing on the lessons learned while working with David. Needless to say, David’s profound influence on cosmological redshift surveys will be felt for many academic generations. Congratulations to David for this well-deserved recognition of his continuing impact on astronomy, cosmology, and its presentation to the public.

Filed Under: blog, feature on homepage

AAS Nova, 14 January 2021

Filed Under: in the news

The ninth and final data release from the ambitious DESI Legacy Imaging Surveys was announced at the January (14th) 2021 meeting of the American Astronomical Society. This major milestone sets the stage for the start of the 5-year survey with the Dark Energy Spectroscopic Instrument (DESI), which aims to provide new insights into the nature of dark energy. See the NOIRLab organization release.

NGC 7619  in DESI Legacy Imaging Survey DR9. Credit: DESI Legacy Imaging Surveys/NOIRLab/LBNL
Hercules Cluster in DESI Legacy Imaging Survey DR9. credit: DESI Legacy Imaging Surveys/NOIRLab/LBNL

Filed Under: announcements

Using machine learning trained on real data, and applied on DESI Legacy Imaging Surveys Data Release 8th has uncovered the 1210 new strong lens candidates, approximately the double of known lenses. This research was presented in the paper Discovering New Strong Gravitational Lenses in the DESI Legacy Imaging Surveys to appear in The Astrophysical Journal. These new lens candidates can be used to make new measurements of cosmological parameters. See the Science Release Note.

credit: DESI Legacy Imaging Surveys/NOIRLab/LBNL

The team behind this discovery is formed by of X. Huang (Department of Physics and Astronomy, University of San Francisco), C. Storfer (Department of Physics and Astronomy, University of San Francisco), A. Gu (Department of Physics, University of California, Berkeley), V. Ravi (Department of Computer Science, University of San Francisco), A. Pilon (Department of Physics and Astronomy, University of San Francisco), W. Sheu (Department of Physics, University of California, Berkeley), R. Venguswamy (Department of Physics, University of California, Berkeley), S. Banka (Department of Physics, University of California, Berkeley), A. Dey (NSF’s NOIRLab), M. Landriau (Physics Division, Lawrence Berkeley National Laboratory), D. Lang (Physics Division, Lawrence Berkeley National Laboratory; Department of Astronomy & Astrophysics, University of Toronto; Perimeter Institute for Theoretical Physics, Waterloo), A. Meisner (NSF’s NOIRLab), J. Moustakas (Department of Physics and Astronomy, Siena College), A. D. Myers (Department of Physics & Astronomy, University of Wyoming), R. Sajith (Department of Physics, University of California, Berkeley), E. F. Schlafly (NSF’s NOIRLab), and D. J. Schlegel (Physics Division, Lawrence Berkeley National Laboratory).

Filed Under: announcements

Primary Sidebar

Copyright © 2018 Dark Energy Spectroscopic Instrument [DESI]

  • / science /
    • science overview
    • cosmology and dark energy
    • redshifts and distance
    • mapping the universe
    • the DESI science mission
    • the DESI survey
    • imaging surveys
  • / instrument /
    • instrument overview
    • telescope
      • tohono o’odham
    • corrector
    • focal plane system
    • fiber system
    • spectrograph
    • instrument control system
    • data systems
    • bringing DESI to life
      • commissioning Instrument
      • protoDESI
  • / collaboration /
    • DESI team
    • DESI builders
    • collaborating institutions
    • sponsors
    • code of conduct
    • vendors
    • collaboration policies
  • / press /
    • announcements
    • in the news
    • press releases
    • tweets by desisurvey
    • blog
    • acknowledgments
  • / galleries /
    • videos
    • image gallery
  • / for scientists /
    • data releases
    • instrument design
    • imaging data
    • target selection and survey validation
    • theory and simulations
    • other DESI science
    • key publications
    • all DESI papers
    • team login
    • request a DESI speaker
    • internal
  • / education & outreach /
    • meet a DESI member
    • blog
    • planetarium show
    • DESI high
    • interactive visualizations
    • DESI Merch

Footer

TEAM LOGIN

twitter   instagram   facebook

Copyright © 2018 Dark Energy Spectroscopic Instrument [DESI]

Copyright © 2025 · Parallax Pro DESI on Genesis Framework · WordPress · Log in