Claire Lamman, Harvard University
August 20, 2021
For many, the term “explorers” brings to mind long ocean voyages, adventurers plunging into jungles, and traders discovering new connections between continents. Exploring, as a profession, became obsolete as there were simply no large, unexplored regions left and Earth became thoroughly mapped out.
However, there are still many uncharted regions beyond our planet. Hundreds of modern-day explorers are mapping out the galaxies around us, a craft that I like to think of as Cosmic Cartography. Fortunately for us, there’s not as much scurvy and snakes involved, but there is a massive effort behind today’s surveys and cosmology comes with its own set of adventures.
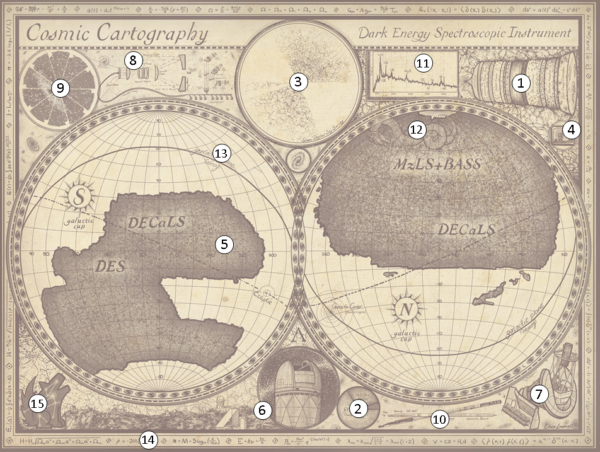
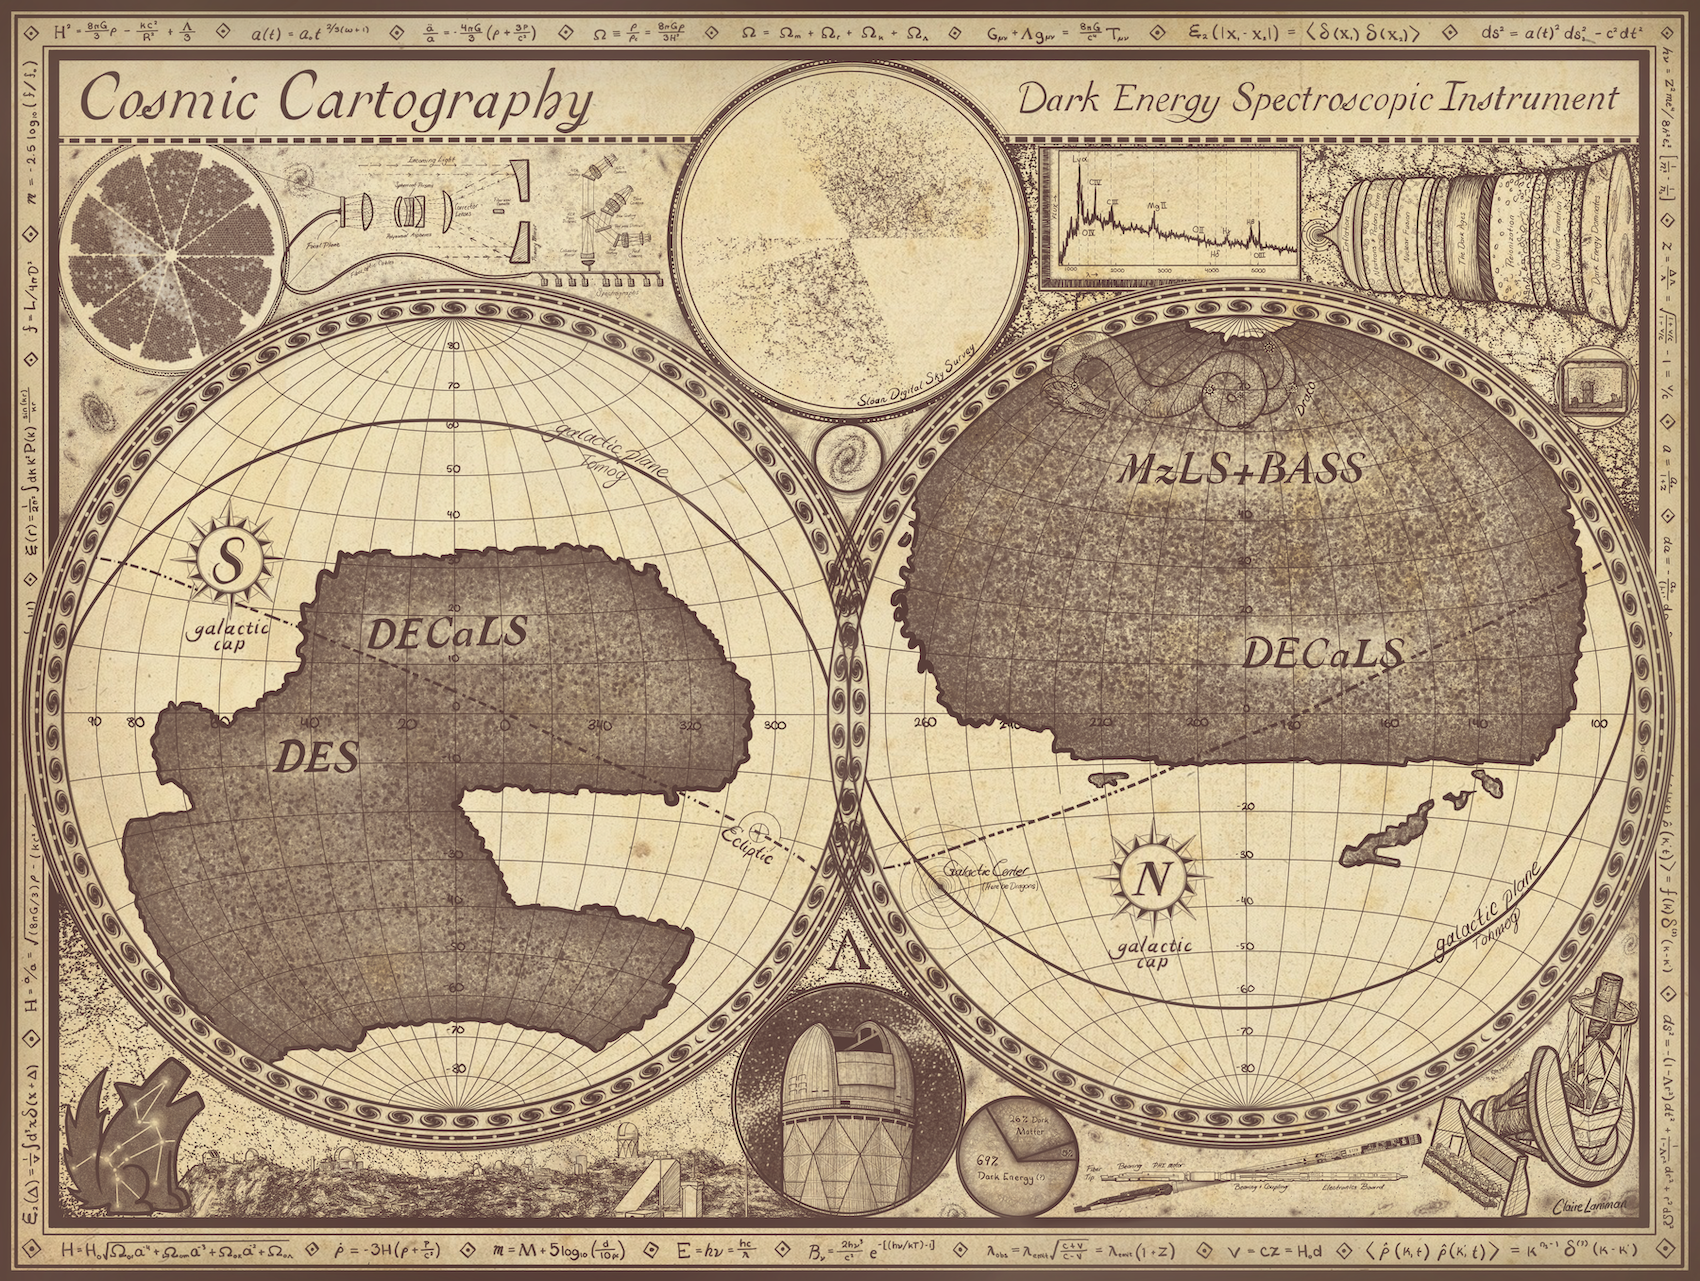
DESI is creating the most detailed map yet of nearby galaxies. To celebrate the connection between early terrestrial and early cosmic explorers, I’ve made this DESI art in the style of early world maps. Here is a guide to some of the details:

- A history of our universe. Since the big bang, our universe went through many changes as matter formed and eventually made stars, galaxies, and us. To understand how these changes happen, and how fast the universe is growing, we need to understand what it’s made of.
- Pie chart of the universe. From our observations, we know that normal matter (the stuff that stars, dust, you, and I are made of) only accounts for about 5% of content in universe. 26% is dark matter- matter we cannot see but can study through how its gravity affects the normal matter and light around it. The other 69% is dark energy. As far as we know, about the only thing it has in common with dark matter is a spooky name. Dark energy is the mysterious force we credit with the rapid expansion of the cosmos. For more information see this blog post.
- Time Map. Light takes time to travel. The light we see from nearby galaxies is relatively young, but from older galaxies it comes from a much older universe. Therefore, we can get a glimpse at what the universe looked like at different times by mapping it out near and far away. This is the map made by the Sloan Digital Sky Survey (SDSS) of galaxies around us. Earth is at the center. It looks like an hourglass because those are the galaxies in the part of the sky where SDSS was measuring. If you look closely, you may be able to see some structure – in places with the most data you can pick out a sponge or web pattern.
- DESI. This is our logo. Our mission is to make a more detailed map so we can explore some of the remaining questions about dark energy and the evolution of the universe.
- The DESI Footprint. This map shows the parts of the sky where DESI is looking. We call it the “footprint”. One chunk is south of the Milky Way (left) and one is north of it (right). DESI has already picked out the 30 million galaxies that we will measure. For more information see this blog post.
- DESI’s home. DESI is located on a mountaintop in Arizona, Kitt Peak (left). It’s part of the biggest telescope on the mountain, the Mayall (right).
- The Telescope. This is what lies under the dome – a massive structure supporting a 15-ton primary mirror, fine-tuned optics, a focal plane, and a separate room filled with spectrographs. More on all of this below.
- How it works. This is a simplified diagram of the telescope. First, light hits the primary mirror. It then reflects up into a series of lenses before hitting the focal plane. The focal plane is a disk of 5,000 robotic positioners, each able to gather the light of their own galaxy. The light from each robot is then sent via fiber optic cables to spectrographs, which measure the light so we can get a spectra for each galaxy (11).
- The focal plane. We often plot the values of each positioner, as they’re positioned on the focal plane. This is a drawing of what we saw when the telescope pointed at Andromeda. This galaxy takes up the perfect amount of sky so that we have a “picture” of it just by looking at positioner values. The other galaxies are far enough away that each gets its own positioner.
- The positioners. Here is a diagram of what one of the robotic positioners looks like, with a drawing of one in the background.
- Spectra. This is the type of measurement we want to get of every galaxy. Light from a galaxy contains many signals, coded in the amount of light that is present for different amounts of energy. When you plot the intensity of light as a function of energy (or wavelength) you see something like this. This is the spectra of a quasar, a brilliant type of galaxy with a very active black hole at its center. We expect to see certain peaks at certain energy levels. These shift based on the galaxy’s movement and allow us to measure its distance. For more information see this blog post.
More details
- Draco. Star locations and art of the constellation Draco. You can’t have an old map without a serpent!
- Tomog. Tomog is the Oʼodham word for the Milky Way. The Tohono O’odham people are native to Kitt Peak and the land surrounding it.
- Cosmic Linguistics. These equations help astronomers describe and study cosmology. They express everything from how further objects look dimmer to how different components of the universe affect its evolution.
- DESI Dog. Our beloved mascot, the DESI coyote, with the constellation Canis major, or “the big dog”.

