• Skip to main content
  • Skip to primary sidebar
  • Skip to footer

Dark Energy Spectroscopic Instrument (DESI)

  • / science /
    • science overview
    • cosmology and dark energy
    • redshifts and distance
    • mapping the universe
    • the DESI science mission
    • the DESI survey
    • imaging surveys
  • / instrument /
    • instrument overview
    • telescope
      • tohono o’odham
    • corrector
    • focal plane system
    • fiber system
    • spectrograph
    • instrument control system
    • data systems
    • bringing DESI to life
      • commissioning Instrument
      • protoDESI
  • / collaboration /
    • DESI team
    • DESI builders
    • collaborating institutions
    • sponsors
    • code of conduct
    • vendors
    • collaboration policies
  • / press /
    • announcements
    • in the news
    • press releases
    • tweets by desisurvey
    • blog
    • acknowledgments
  • / galleries /
    • videos
    • image gallery
  • / for scientists /
    • data releases
    • instrument design
    • imaging data
    • target selection and survey validation
    • theory and simulations
    • other DESI science
    • key publications
    • all DESI papers
    • team login
    • request a DESI speaker
    • internal
  • / education & outreach /
    • meet a DESI member
    • blog
    • planetarium show
    • DESI high
    • interactive visualizations
    • DESI Merch

DESI High, the School of the Dark Universe, is Back!

April 24, 2025 by

You are here: Home

English

by Alma González (University of Guanajuato, Mexico) and Martine Lokken (Autonomous University of Barcelona, Spain)

24 April 2025

DESI’s educational program for high school students, DESI High, is now back in session!

Designed so students can work with DESI data directly from the telescope, the program also introduces fundamental concepts in cosmology and helps develop computer programming skills. The program was a huge hit with students in online events held during the pandemic and for a couple of years thereafter. However, it has been a while since we offered an event, especially in person.

But now DESI High is coming back in full swing. We are re-factoring and improving our Jupyter notebooks, testing new platforms to host them, and more importantly, we are adding examples that illustrate how to access the now publicly-available DESI data and new notebooks.  Beyond that, we are aiming to offer new tutorial sessions on how to use such materials, both in-person and online. In February, we hosted the first two events of 2025, in Cozumel, Mexico and Catalonia, Spain.

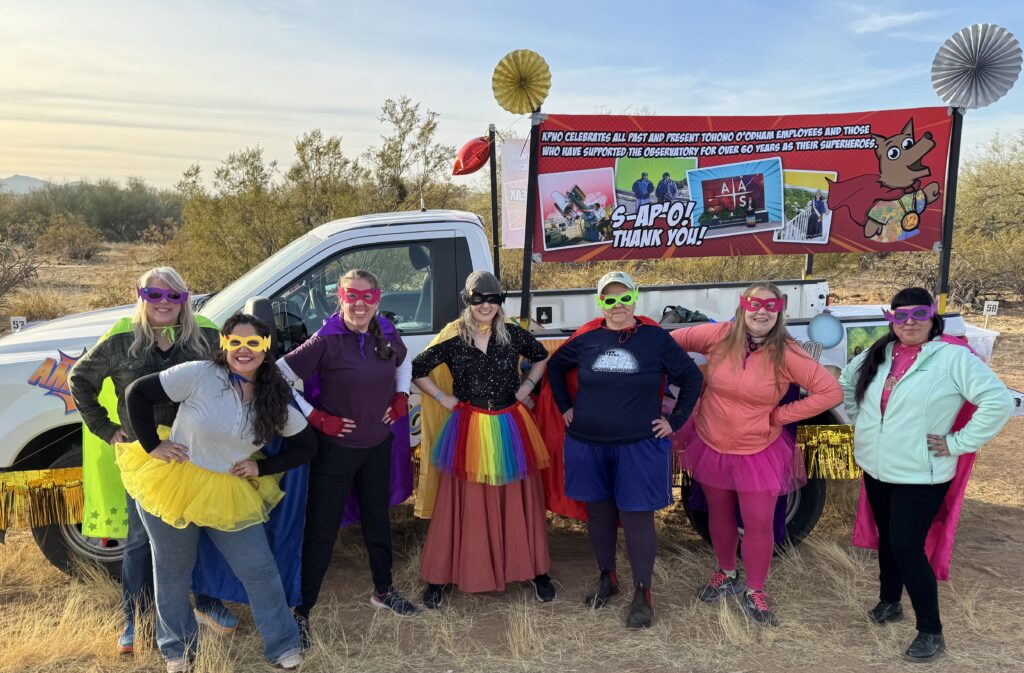
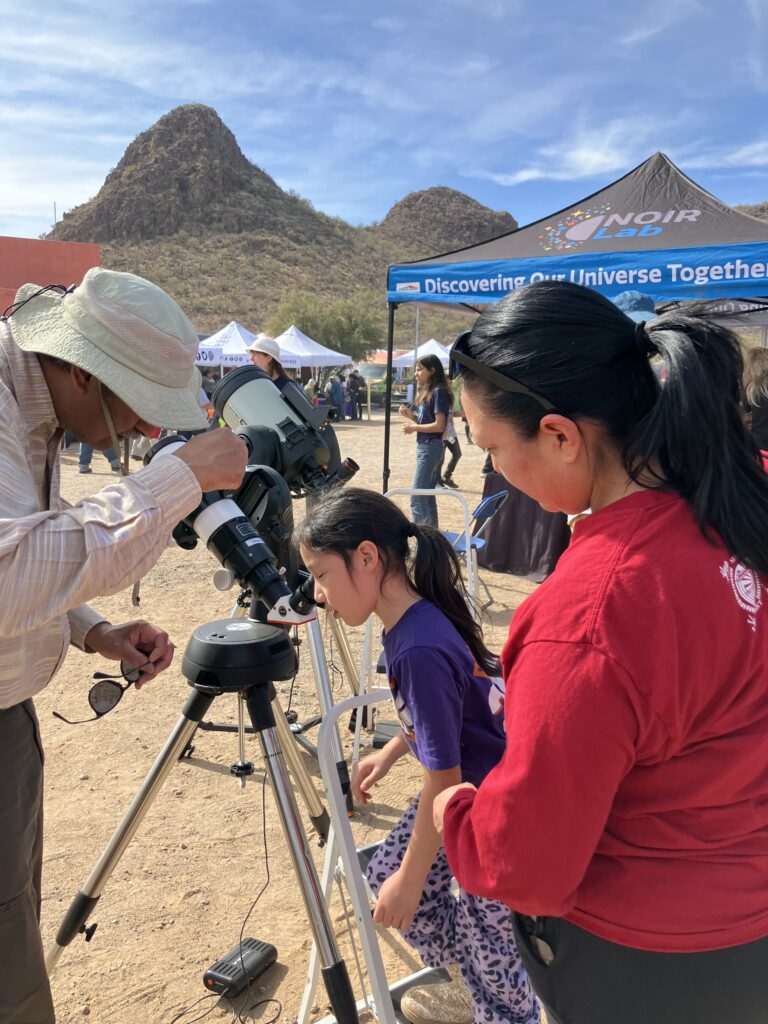
Our first event, held on February 8th, was co-organized with the Cozumel Planetarium, CHA’AN KA’AN, who invited us to commemorate the International Day of Women and Girls in Science (February 11th). Of the approximately 20 participants who joined us on the day of the event, many were female students from the Quintana Roo area, which is located in the southern part of Mexico. Over a two-hour hybrid session, the participants interacted with DESI members, including  Andrea Múñoz from the National Autonomous University of Mexico (UNAM, Phd Student), Diego González from University of Guanajuato (UG, Msc student), Maria Pineda (UNAM, undergraduate student), John Suarez from Monterrey Institute of Technology in Guadalajara (researcher), Fanny Rodríguez (UNAM, MsC student), a non-DESI undergraduate student Daisy Torres (UG) and Alma Gonzalez (UG, researcher). Mariana Vargas (UNAM, researcher), also a DESI member, participated as well in preparations for the event.

Students at the CHA’AN KA’AN planetarium (Cozumel, Mexico), attending our remote delivery of the DESI High tutorials on 8 February 2025. (Credit: CHA’AN KA’AN planetarium)

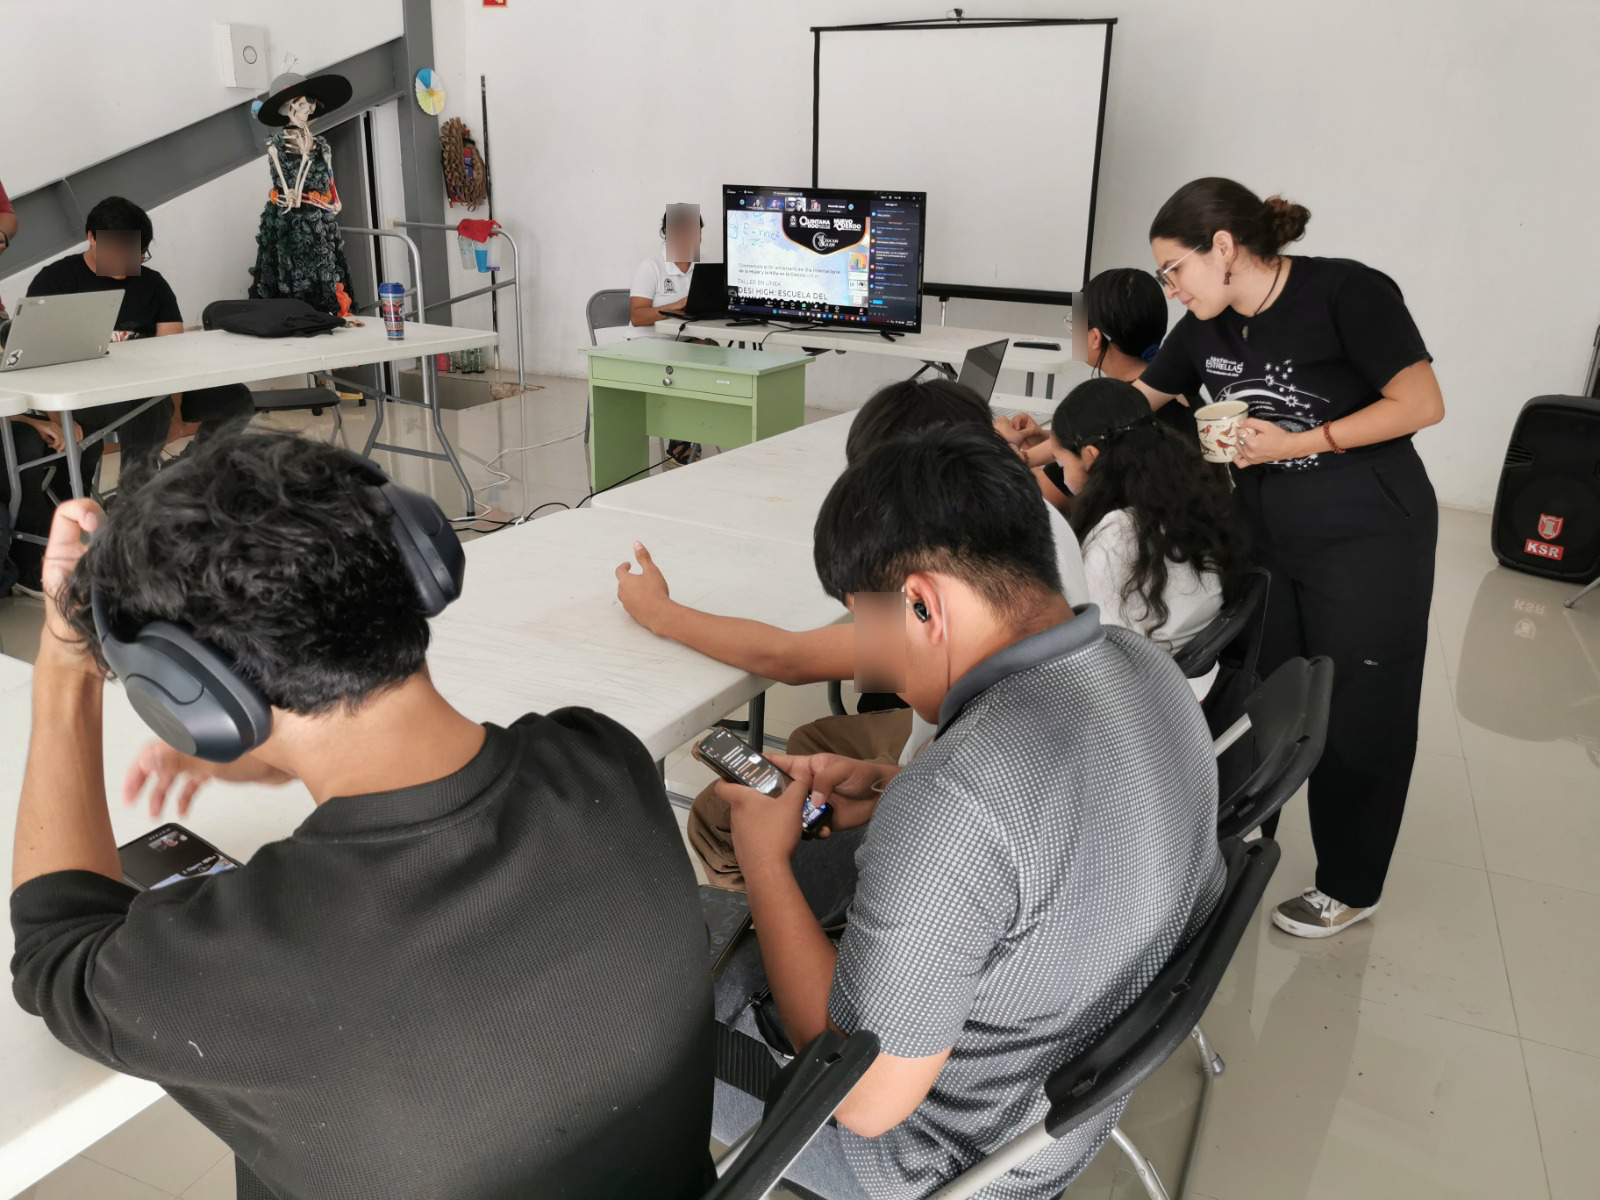
The session began with an introduction to DESI science as well as time for the students to get to know the instructors’ motivations to get into science and what their daily life is like working in DESI. Then, the instructors and students delved into the DESI High notebooks in Spanish! For this session, we partnered with Camber Cloud, a first-of-its-kind scientific and research cloud computing platform that provides low/no-code “science engines” for researchers to run simulations, analyze large data sets, and train AI models. They kindly provided test accounts for our students so that they could experience the entire process of making a copy of the DESI High repository, running the notebooks, and saving their progress. While we also offer other platforms to just plug-and-play, this gave students the opportunity to see the entire process from start to finish, which all worth it. We are expecting to have a follow up session with this team.

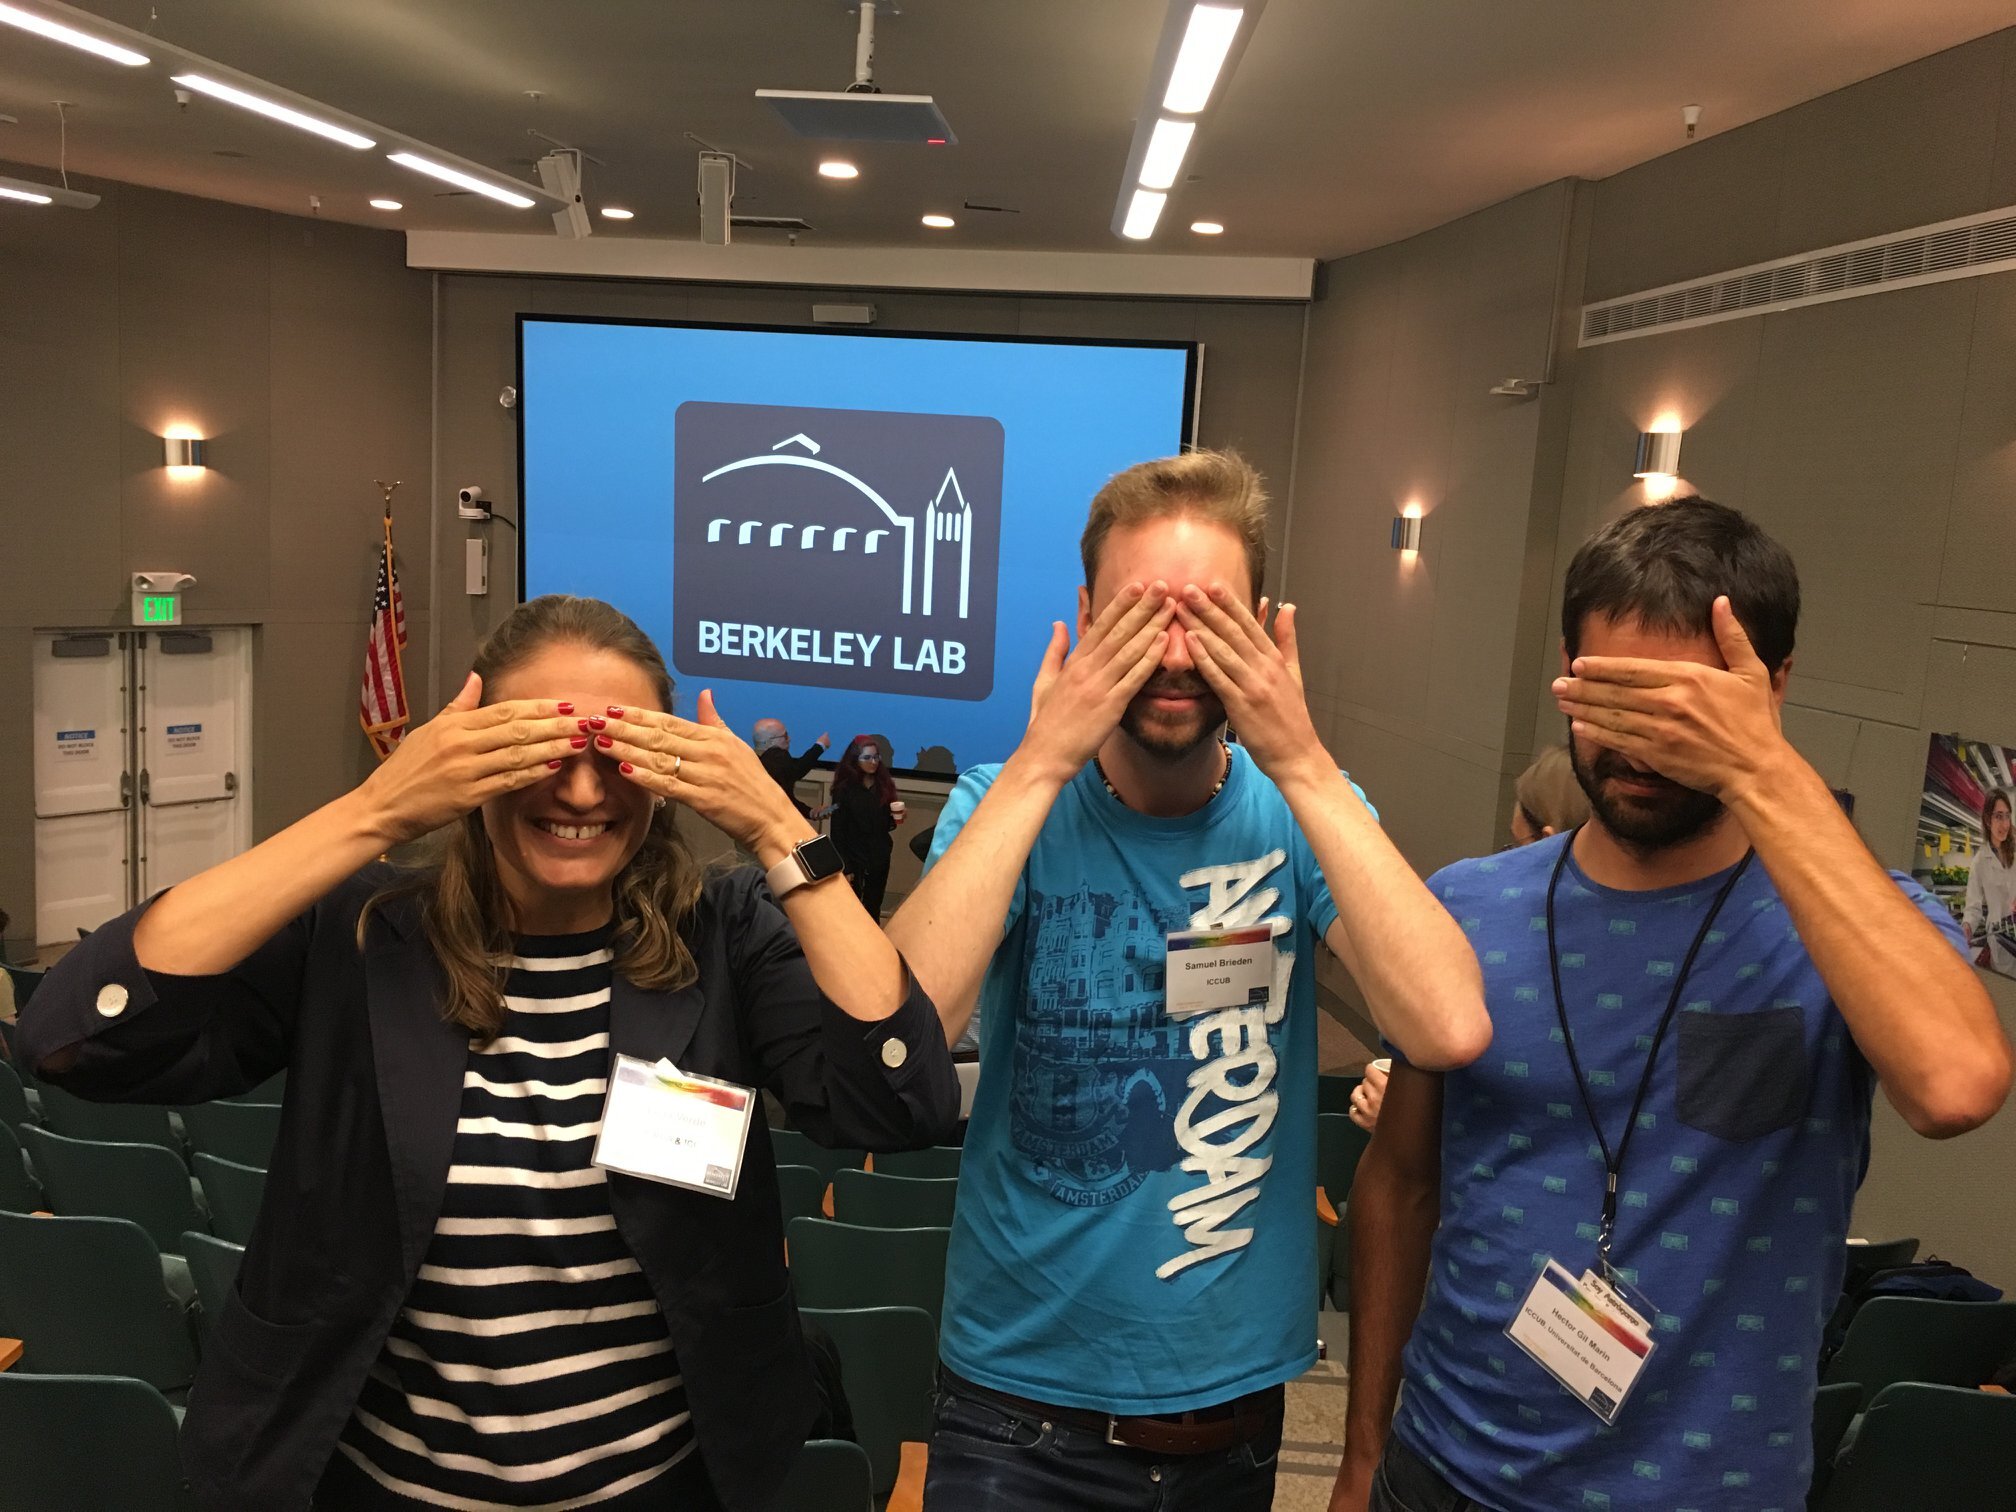
At the second event, on Feb 22, approximately thirty high school students from across the province of Catalonia, Spain, joined us at the Autonomous University of Barcelona campus to learn how DESI is measuring our universe’s expansion. For the cosmology edition of the “Bojos per la Física” (“crazy for physics”) annual program, three cosmologists from the Institut de Física d’Altes Energies (IFAE) led the students through the introductory DESI High tutorial notebook. This notebook uses Python code to demonstrate how measuring the spectra of distant galaxies translates into understanding the universe’s contents. The students also got an overview of how the DESI telescope works, and examined a prototype of the Guide-Focus-Acquisition (GFA) cameras that IFAE engineers developed to help guide the DESI robotic fiber array.

Instructors and students at IFAE on the DESI high tutorial session at “Bojos per la Física”. (Credit: Josep Freixanet, IFAE)

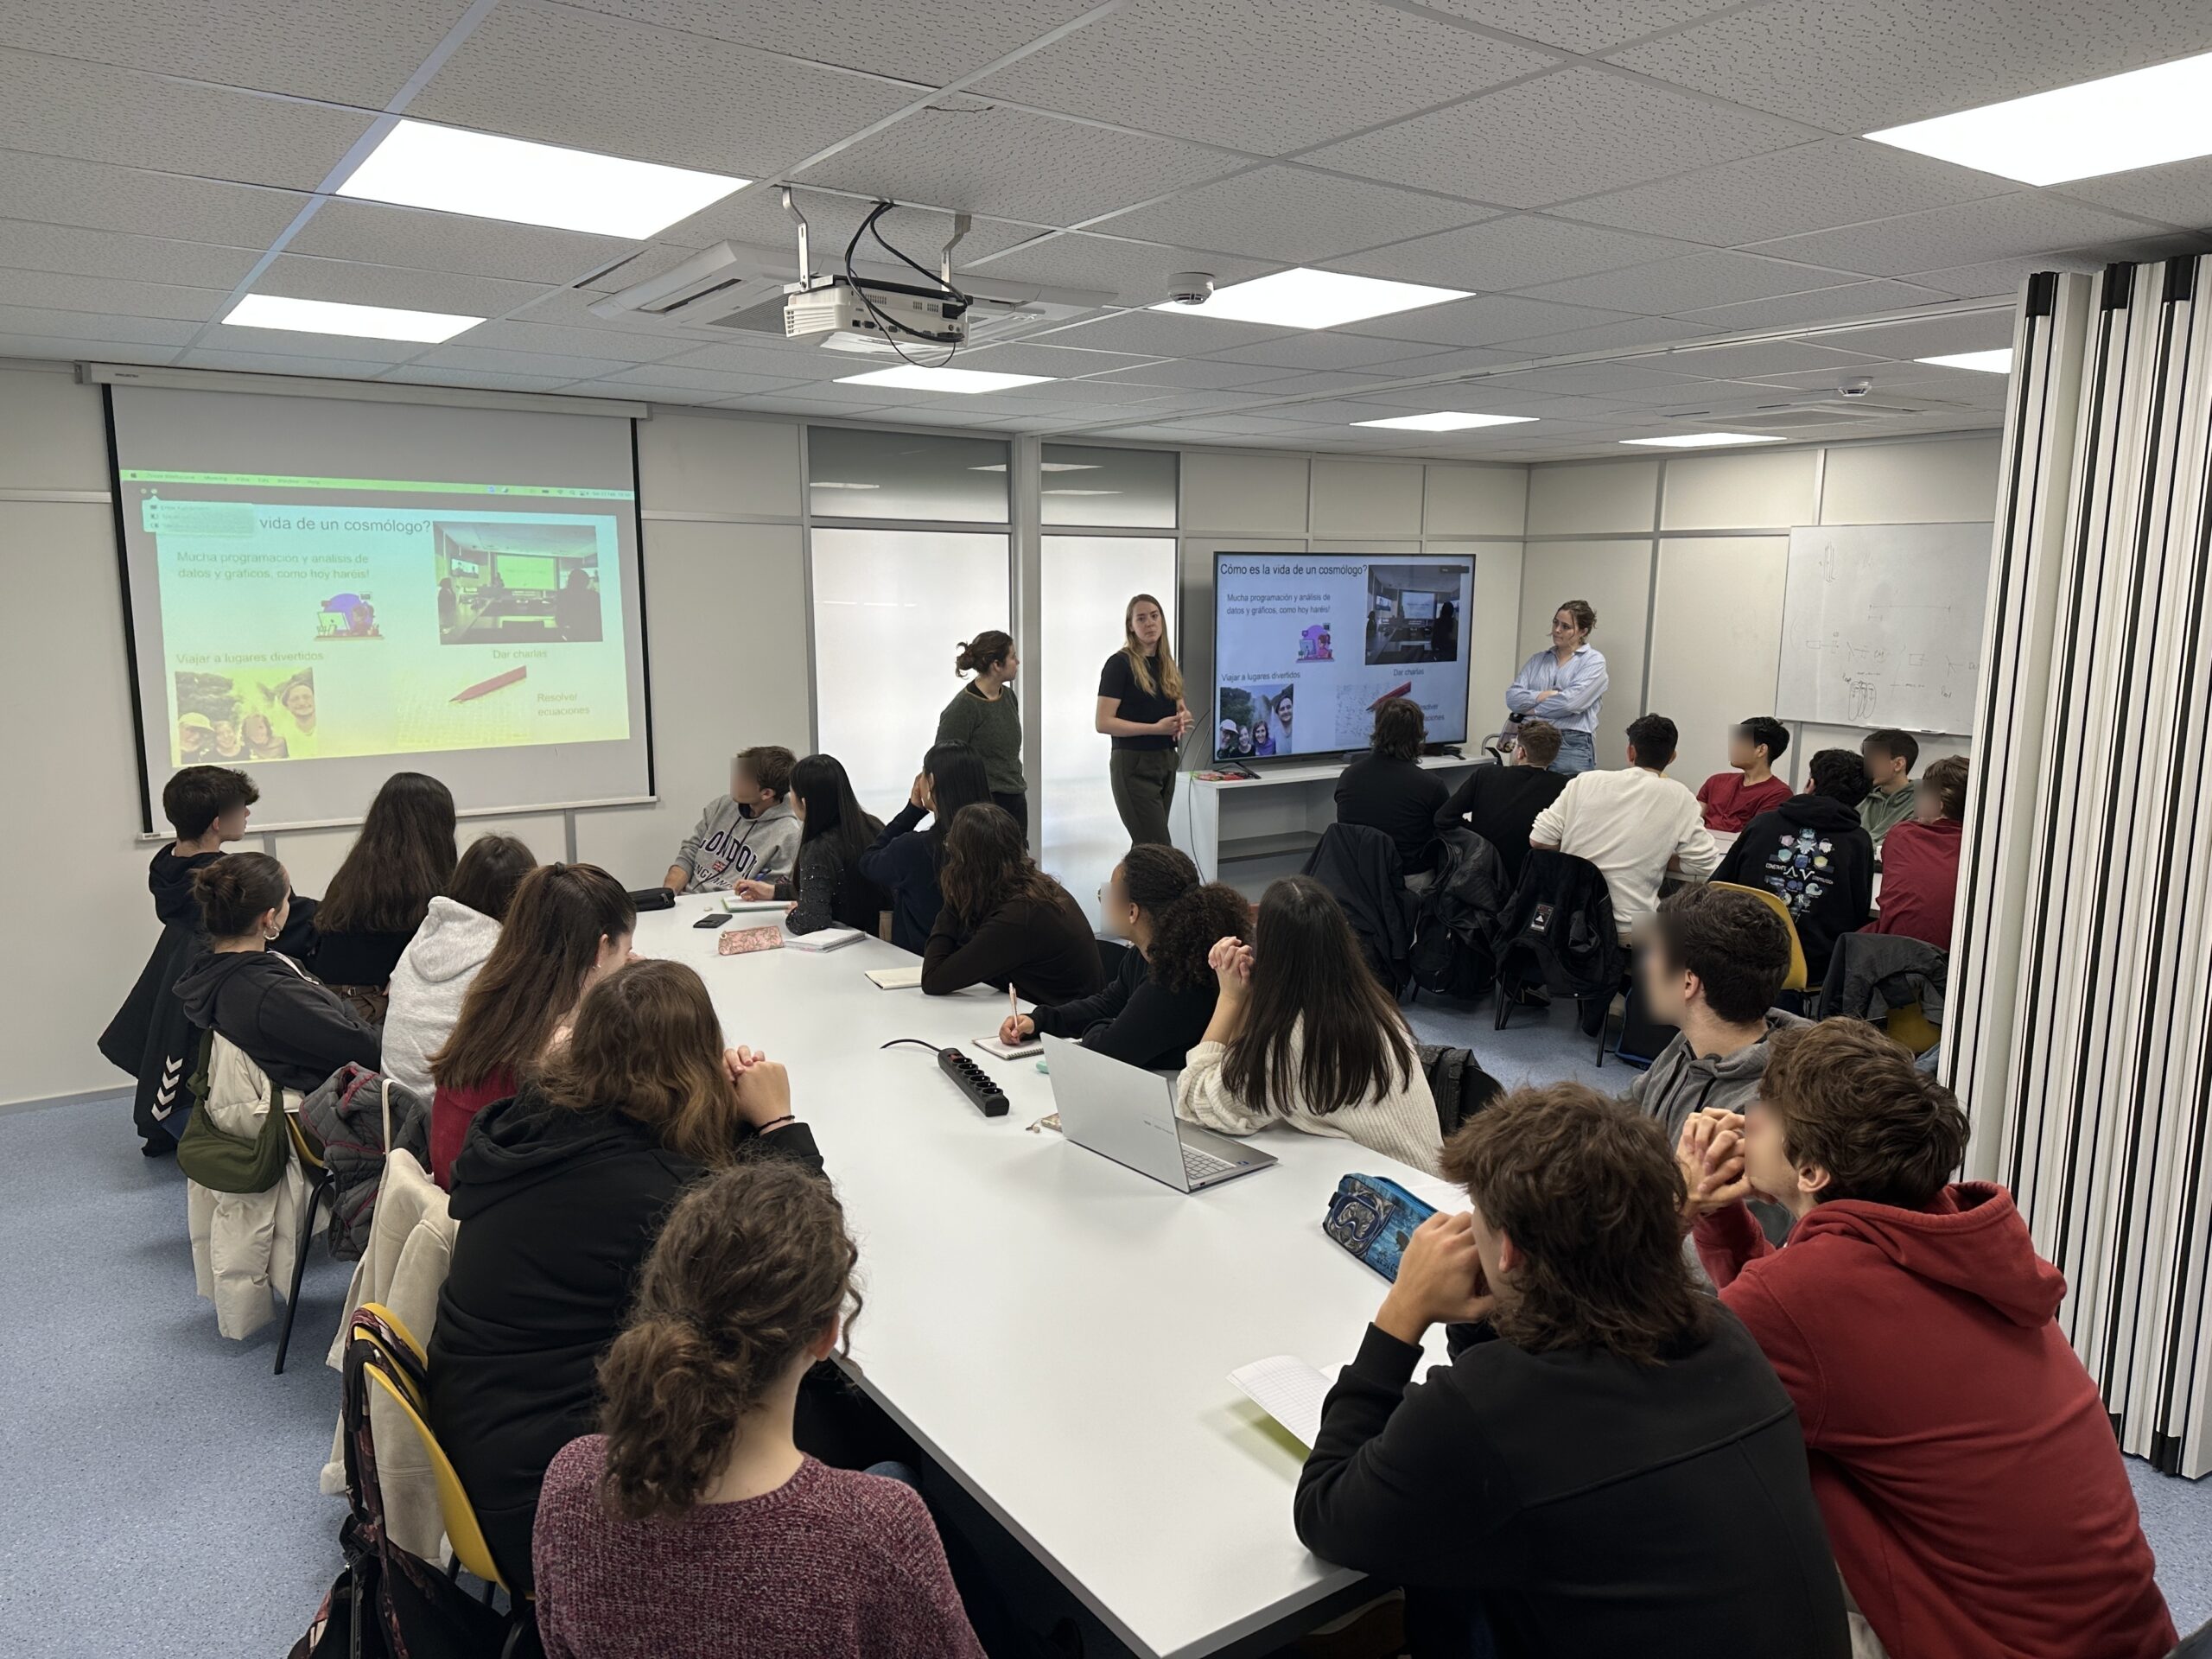
The day’s activities were run by DESI members Laura Casas (Phd student) and Martine Lokken (Postdoc), and Dane Cross (PhD student in the DES collaboration), who also shared what their day-to-day research life is like. Many of the students are interested in pursuing physics in the future, some in astrophysics and cosmology, and this program helped them understand the current research landscape as well as a typical day in the life of a cosmologist.

In the next few months, the DESI High team will be finalizing updates to the repository. Besides updating the current Jupyter notebooks to work with data from the DESI’s first data release (public as of 19 March), we will also introduce some new notebooks. One will feature a shorter but more straightforward introduction to Dark Energy and DESI. Another one will illustrate how we measure distances in cosmology. And a third will introduce Baryon Acoustic Oscillations! With these visually interesting, step-by-step Jupyter notebooks, we look forward to many future events that use the DESI High tutorials to spread the excitement of cosmology and DESI discoveries!

— edited by Joan Najita

Filed Under: blog, feature on homepage

Data and Analysis also in Demand

by Joan Najita (NOIRLab)

14 April 2025

DESI’s 19 March 2025 press release, which reported the likelihood that dark energy is evolving, sparked excitement and engagement across the globe, from both the general public and the scientific community. Announced by Berkeley Lab and 23 collaborating DESI institutions that published partner releases, the news led to significant media coverage.

As of 27 March 2025:

  • More than 1,500 articles reporting the news had appeared worldwide in 67 countries.
  • Dozens of the world’s most respected science news and media outlets covered the story.
  • Articles appeared in 35 languages, with one quarter of the articles published in a language other than English.
Reporting on the DESI Year-3 results, 1500+ articles appeared across the globe in Albanian, Armenian, Bosnian, Bulgarian, Catalan, Chinese, Croatian, Danish, Dutch, English, Estonian, Finnish, French, German, Greek, Hebrew, Hindi, Hungarian, Indonesian, Italian, Japanese, Kazakh, Korean, Norwegian, Polish, Portuguese, Romanian, Russian, Serbian, Slovak, Spanish, Tagalog, Thai, Ukrainian, and Vietnamese. (Credit: Lauren Biron/Berkeley Lab)

For Berkeley Lab Science Writer Lauren Biron, who organized the press release effort for the collaboration, “It was a real privilege to be trusted with DESI’s secrets ahead of time, and to play a small part in telling DESI’s story. The collaboration put such effort and care into the results and the announcement, so it was gratifying to see DESI’s news spread far and wide. This is certainly one of the most far-reaching results I’ve ever been involved with as a science writer.”

Biron attributes part of the media success to the beautiful visualizations of the DESI data created by NOIRLab, Fiske Planetarium, and DESI’s Claire Lamman: “Those maps and flythroughs of the galaxies conveyed at a glance the impressive scope of the experiment, and evoked a sense of wonder and awe at our universe. They made it easy for folks to get excited about the science.”

Delicate frothy structure in the spatial distribution of galaxies, as mapped by DESI, above and below the plane of the Milky Way. Earth is at the center, and every dot is a galaxy. Bluer points indicate more distant objects. (Credit: DESI Collaboration / DOE / KPNO / NOIRLab / NSF / AURA / R. Proctor)

In creating his visualizations, color selection was important to NOIRLab’s Ron Proctor, who found the white-to-blue color scheme best at highlighting the intricate structure in the DESI dataset. The color scheme also evokes a connection to human experience. To DESI Director Michael Levi, the color scheme suggested “the white surf of the nearby galaxies and the deep sea of those faraway.” Surprised and delighted to see his work featured in the New York Times and on the cover of Le Monde, Proctor says, “It feels good to know I’ve contributed to something that is so meaningful and effective.”

The media coverage surpassed even that of last year’s April 2024 press release. While the earlier release, which reported the first hints of evolving dark energy based on the first year of DESI data, had been widely covered in the media, this year’s release, which reported results from the first 3 years of DESI data, generated more news articles (1500+ vs. 1200+) in more languages. It also resulted in much higher engagement (the number of likes, shares, and comments on those articles received online): a whopping 191,000 this year vs. 32,000 last year.

Beyond the media coverage, the response from the scientific community has also been strong, with the DESI papers reporting the science results and the Year-1 data release attracting a lot of attention.

As of 9 April 2025,

  • 575 TB of data have been downloaded from the NERSC, the Berkeley Lab computing facility (with 197 TB downloaded directly from data.desi.lbl.gov, and 378 TB using globus to access the NERSC data transfer nodes).
  • 15,000 new users have visited data.desi.lbl.gov.
  • The 3 science papers reporting the main results have been downloaded 21,500 times from data.desi.lbl.gov/doc/papers, and potentially many more from the arXiv preprint server.
  • Value Added Catalogs provided by the science collaboration in association with the data release have been downloaded 12,000 times.
Weekly new users to data.desi.lbl.gov for the last 12 months (solid line) and the previous 12 months (dashed line), illustrating the large increase in web traffic associated with the March 19 press release and data release. (Credit: Stephen Bailey/Berkeley Lab)

With the potential to spark completely new ideas and applications than those they were originally designed to address, who knows what new discoveries will emerge from these DESI data?!

Note: Sincere thanks to Stephen Bailey (Berkeley Lab) for compiling and sharing the data usage statistics.

Filed Under: blog, feature on homepage

Reuters, 19 March 2025

Filed Under: in the news

Quanta Magazine, 19 March 2025

Filed Under: in the news

Nature, 19 March 2025

Filed Under: in the news

Science Magazine, 19 March 2025

Filed Under: in the news

Scientific American, 19 March 2025

Filed Under: in the news

New York Times, 19 March 2025

Filed Under: in the news

DESI has made the largest 3D map of our universe to date and uses it to study dark energy. In this visualization, Earth is at the center, and every dot is a galaxy.
(Credit: DESI collaboration and KPNO/NOIRLab/NSF/AURA/R. Proctor)

New results from the first 3 years of DESI data strengthen hints that dark energy is evolving, with consequences for our understanding of nature and the fate of the Universe. Read more in the March 2025 BerkeleyLab Press Release. Videos discussing the results are available on the DESI YouTube channel. Further details are available in our guide to the publications reporting these results. The papers themselves are available here.

A new DESI data release is also now available for all to explore. The largest dataset of its kind ever shared, it contains information on 18.7 million galaxies, quasars, and stars. Read more in a companion BerkeleyLab Press Release.

Filed Under: announcements

by Gillian Beltz-Mohrmann (Argonne National Laboratory)

19 March 2025

The first known blind experiment was conducted by the French Royal Commission on Animal Magnetism in 1784. In the experiment, the researchers literally blindfolded participants and asked them to identify objects that the experimenters had previously filled with “vital fluid,” which none of the participants were able to do. Today, many experiments rely on “blinding” techniques to prevent sources of bias from influencing the results. Many people have probably heard of blind analyses in the context of medical studies, in which the participants in some clinical trial do not know whether they are receiving a drug or a placebo. Withholding this information reduces the risk of confirmation bias (i.e., participants reporting better outcomes because they know they are receiving medication).

The purpose of blinding in other areas of research is much the same: to eliminate the risk of confirmation bias influencing the results of the analysis. The past several decades of cosmology have led us to a model known as LCDM, which describes a flat Universe made up of cold dark matter (CDM) undergoing accelerated expansion described by a cosmological constant (L). LCDM has been favored by numerous observational studies and has thus become the accepted “standard cosmological model.” However, the fact that the model is so widely accepted comes with risks: when we analyze a new data set, it might be tempting to assume that LCDM is going to be the preferred model. While this temptation might be subconscious, it can still lead us to unknowingly bias our results. To avoid this, we need to do a blind analysis!

DESI measures the positions of millions of galaxies in the Universe. Our understanding of the early Universe predicts that these galaxies will preferentially be separated by a particular distance, known as the baryon acoustic oscillation (BAO) scale. The size of this distance is determined by the fundamental ingredients of the Universe (e.g., the amount of dark matter, the amount of dark energy, and the nature of dark energy, just to name a few). By choosing different combinations of these ingredients (also known as cosmological parameters), we can make various predictions for the BAO scale, and determine which prediction agrees the best with our observations.

To perform this analysis blind, the measurements are first altered and the analysis methodology is developed using the altered data. As a result, the researchers don’t know what answer is preferred by their real data until the very end, when the alterations are undone (“unblinded”), the analysis is carried out on the real data, and the true results revealed. In other words, no one involved in the analysis of the data should be able to tell what amounts of dark matter and dark energy are preferred by the real data until the final step of the analysis. As the analysis pipeline is being developed, various checks are performed to ensure that there are no errors or bugs. Only once all of these checks are passed is the final analysis performed on the unblinded data and the cosmological parameters revealed.

In April 2024 DESI released the BAO results from its first year of data, reporting a surprising result: a slight preference for a model with a time-varying dark energy equation of state. This is in stark contrast to the standard LCDM cosmological model, which includes a constant dark energy density (i.e., not varying over time). The new preference for a time-evolving dark energy, a model known as w0waCDM, was strengthened further when the DESI data were combined with other datasets (Cosmic Microwave Background measurements and Type Ia Supernovae distances). Because the preference for w0waCDM based on the Year 1 data was moderate, DESI would have to collect more data to get a clearer picture of whether this was an anomalous result or whether we had discovered something new about the cosmos.

The December 2024 meeting of the DESI Collaboration came with an exciting prospect: the unblinding of the BAO results from the first 3 years of DESI data! This historic event would give us the first indication of whether the w0waCDM cosmology would still be preferred with the inclusion of more data.

The “live unblinding,” at which the collaboration would witness the results for the first time, was scheduled for Thursday evening. But before this could occur, a final consensus had to be reached about whether to indeed proceed with the unblinding. A Tuesday evening session was scheduled to discuss last minute analysis choices and decide whether all of the necessary checks had been passed in order to proceed with the unblinding. The stakes of the session were high: once the data was unblinded, it could not be blinded again. After a long discussion, which lasted about an hour longer than it was scheduled to, the decision was made: the unblinded analysis would proceed as scheduled!

Tuesday’s session was led by Sesh Nadathur, an STFC Ernest Rutherford Fellow at the Institute of Cosmology and Gravitation at the University of Portsmouth. Recalling the experience, Sesh said, “Tuesday was a long and exhausting day – the whole collaboration felt they had a stake in the results, and we must have had 100 people in the room or joining the call. That was a great feeling, but I also felt a lot of responsibility to ensure we took everyone with us and everyone bought into our decision to move ahead with the unblinding. At the same time, we knew the decision had to be agreed upon in that session otherwise the whole timeline would have been thrown off! By the end, my overwhelming emotion was just relief that we’d gotten there.”

The BAO analysis team spent the next two nights getting very little sleep in order to ensure the timely delivery of the results. Cristhian Garcia-Quintero, a NASA Einstein Fellow at Harvard University and a member of the analysis team, recalled, “Once we got the green light on Tuesday, I was very nervous because we needed to have the unblinded results ready to present by Thursday. There was a lot to do in a short amount of time, and everyone was waiting on the results.” Sesh added, “It was only possible to complete the analysis because of the incredible work that Cristhian and Uendert Andrade (a postdoctoral fellow at the University of Michigan) did on those two days, with massive help from many others in the months leading up to the meeting to set everything up to process all the results so quickly.”

By Thursday morning, Sesh and Cristhian were able to examine the final results for the first time. Over the next few hours, Sesh worked hard to put his presentation together in time for the evening unblinding session, a process he describes as “Actually the best experience of my career so far! It was that extremely rare combination of learning the answer to a very important scientific question – and recognizing immediately that it was very important, rather than slowly realizing this over time, which is the more usual case – and for a few hours being one of only two people in the whole world who knows it.”

Sesh and Cristhian spent all of Thursday deftly deflecting questions about the status of the unblinded results. Cristhian found that “Lots of people were joking with me throughout the day, asking for a sneak preview of the results.” Sesh had a similar experience: “All day people asked me subtle questions about the results and tried to read my expression to guess which way things had gone. I had to try to keep a poker face!”

By the end of the day, the two had artfully managed to keep the results concealed from everyone. Sesh even went so far as to refuse to upload his slides to the meeting website until after his presentation. He explained, “I really wanted to make the result reveal in the plenary talk as theatrical and memorable an experience for everyone as possible. This was not just about keeping the results secret until then, but also about trying to present as comprehensive an overview of the cosmology results as possible, and being prepared to answer all questions on the spot. I didn’t want people to come away with questions, and only slowly discover things in the weeks afterwards, because this could dilute the experience.”

A slack message sent minutes before the live unblinding.

As Sesh prepared to deliver his talk, the energy in the room was palpable. Cristhian recalled, “Once we were in the unblinding session, I could see the anticipation in everyone’s faces and feel it in the room. The biggest difference compared to the Year 1 unblinding was that in Year 1 the dark energy results came as a surprise, but in Year 3 there was a lot of expectation from the collaboration.” As an attendee at the meeting, I can honestly say that I have never been so excited about a conference presentation. It was a privilege to bear witness to the unveiling of results that had the potential to reveal something new and strange about the Universe.

The author at the December 2024 unblinding event. (Credit: Kate Storey-Fisher)

Building the drama of the moment, Sesh made us wait for the results while he explained the science behind the BAO measurement (and then added a couple of extra slides just for fun). Finally, we arrived at the moment we had all been waiting for: the big reveal of the constraints on the dark energy equation of state. Was the preference for evolving dark energy from the Year 1 analysis a fluke? Or is DESI was onto something big?

An extra slide from Sesh Nadathur heightened the anticipation.

At last, the results were revealed: the preference for a time-evolving dark energy was confirmed! With the increase in data from Year 1 to Year 3, the constraints on the cosmological parameters governing the dark energy equation of state were tightened, strengthening the results and making history in the process. The findings provide further indication that a cosmological constant is not the origin of cosmic acceleration, but rather that dark energy is a kind of dynamically evolving fluid that pervades all of space. With this result, a whole new era of cosmology begins.

DESI Ambassador BaoBan expressing his excitement at the DESI Year-3 BAO results. (Credit: Kate Storey-Fisher)

Cristhian Garcia-Quintero said of the results, “It seems like in the end, the data is hinting more strongly that there is something wrong with the standard model of cosmology, and dark energy is potentially that ‘something,’ but we need to be patient, keep paying attention to these tensions in the data, and keep performing careful analyses.”

Enrique Paillas, a postdoctoral fellow at the University of Arizona and a member of the analysis team, said “The Year 3 unblinding was at the same time, one of the most difficult and exciting periods of the last year. We needed to be very diligent with all the tests required to ensure our cosmological constraints were robust against potential systematic errors. Delivering the results in our allocated timeframe was only possible thanks to the contribution of many talented scientists across all career stages. After all the hard work, we couldn’t really contain the excitement once we finally unveiled the results. It was a very rewarding experience on many levels.”

Reflecting on the time since the unblinding, Sesh said, “The past three months getting the results ready for publication have been the hardest I’ve worked — a stretch of about 120% effort! I was anticipating this of course. With a subject is as sensitive and important as this, we’ve really had to make sure every argument is absolutely watertight and backed up by multiple calculations and tests. It’s a very important and impactful result, but one that is naturally going to face a lot of skepticism. Working to present the arguments in the most logical and convincing form, and crafting a paper that people will hopefully also enjoy reading — that’s a challenge I have actually enjoyed thinking about. I hope we have achieved it!”

— Edited by Joan Najita

To learn more:

Read about how blinding works and what it’s like to work this way in an interview with Sam Brieden, Uendert Andrade, and Juan Mena-Fernández.

Read about the Year 3 BAO results in the LBNL press release.

Filed Under: blog, feature on homepage

On March 19, DESI released a set of papers providing the measurements and interpretation of Baryon Acoustic Oscillations (BAO) based on Data Release 2 (DR2) – the first three years of survey data. This page contains a guide to the publications and main results. The papers are available here and on arXiv.

In addition to these new results, Data Release 1 (DR1) is now publicly available, with its corresponding paper summarized at the end of this guide. For summaries of the papers based on DR1 results, see our 2024 paper guides from April 4 and November 19.

One of many contours covered in the DR2 BAO cosmological analysis paper, showing the constraints on parameters of evolving dark energy. Credit: Cristhian Garcia-Quintero
An annotation of the above key figure for general audiences. The Universe grows, so the total density of matter goes down. But dark energy is different! This plot describes the “behavior” of dark energy – how its density changes as space expands. Credit: Claire Lamman

Helpful links

  • A press release containing a high-level overview of our main results: https://newscenter.lbl.gov/2025/03/19/new-desi-results-strengthen-hints-that-dark-energy-may-evolve/
  • A press release covering Data Release 1: https://newscenter.lbl.gov/2025/03/19/desi-opens-access-to-the-largest-3d-map-of-the-universe-yet/
  • DESI’s YouTube channel, including a playlist of videos covering the DR2 BAO results: https://www.youtube.com/@DESISurvey
  • A short video on our results for the general public: https://youtu.be/Td0jakzT-Lk
  • A list of key publications from DESI: https://data.desi.lbl.gov/doc/papers/
  • For more background on DESI’s science, see our public webpages.
  • DESI’s public data releases, now including DR1: https://data.desi.lbl.gov/doc/releases/

The DR2 results fall into seven main analysis categories as shown in the first figure below. The two on the left-hand side highlighted in green focus on galaxy and quasar clustering, as well as clustering of the Lyman-alpha forest, and include the BAO results released on March 19. Also highlighted in green is cosmological inference, which is based on measurements from both the Lyman-alpha forest and galaxy and quasar clustering. The bottom figure lists the papers released on March 19, featuring two key papers along with five supporting papers.

The seven categories for DESI DR2 analysis, with the three highlighted in green corresponding to results released on March 19. Credit: Gustavo Niz and Alejandro Aviles
The two key papers and several supporting papers released on March 19. Credit: Gustavo Niz and Alejandro Aviles

March 19 Paper Summaries

BAO Measurements from the Lyman-alpha Forest

Baryon Acoustic Oscillations (BAO) are a powerful standard ruler in cosmology, originating from ripples in the density of matter from the early universe. This ruler is used to constrain the universe’s expansion history by measuring the clustering of various tracers of the matter-density field. The most distant tracer used by DESI is the Lyman-alpha (Lyα) forest, a collection of absorption lines seen in the spectra of high-redshift quasars that map the distribution of neutral matter in the intergalactic medium. DESI’s DR2 results provide the most precise measurement of the BAO scale above redshift two.

DESI DR2 Results I: Baryon Acoustic Oscillations from the Lyman Alpha Forest

arXiv: 2503.14739

Summary: We have obtained the most precise measurement of the baryon acoustic oscillation scale above redshift two ever recorded, with a statistical precision of only 0.65 percent. The extremely high quality of this measurement when the universe was only about 3 billion years old is an important part of DESI’s new results on the history of cosmic expansion.

This plot shows the Lyman-alpha BAO measurement from DR2 with statistical-only uncertainties (red contour) and statistical+systematic uncertainties (solid indigo contour). The previous results from DESI DR1 are also shown (light-blue contour), as well as constraints inferred from Planck cosmic microwave background (CMB) data assuming ΛCDM (orange contour). Lastly, the combination of Planck CMB and DES Year 5 supernovae data assuming w0waCDM is shown (dotted black contour).

Validation of the DESI DR2 Lyα BAO analysis using synthetic datasets

Corresponding author: Laura Casas

arXiv: 2503.14741

Summary: The second data release (DR2) of the Dark Energy Spectroscopic Instrument (DESI), containing data from the first three years of observations, doubles the number of Lyman-α (Lyα) forest spectra in DR1 and it provides the largest dataset of its kind. To ensure a robust validation of the BAO analysis using Lyα forests, we have made significant updates to both the mocks and the analysis framework used in the validation, which we present in this paper. The figure presents the BAO measurement results from two sets of mocks: a stack of 100 Saclay mocks (previously used in DR1) and 300 CoLoRe-QL mocks (a new set of Gaussian Lyα mocks that incorporate a quasi-linear input power spectrum to model the non-linear broadening of the BAO peak). Our goal was to recover the true BAO parameters within one-third of the statistical uncertainty from DESI DR2 (represented by the black dotted line in the figure). The results indicate we are very close to meeting this criterion, and we discuss the small bias observed in Section 5 of the paper.

Construction of the Damped Lyα Absorber Catalog for DESI DR2 Lyα BAO

Corresponding author: Allyson Brodzeller

arXiv: 2503.14740

Summary: Damped Lyman-alpha absorption (DLA) systems are neutral hydrogen reservoirs with column densities N(HI)>2×1020 cm-2 observable in the Lyman-alpha forest of some quasars. The absorption profile of DLAs consist of broad damping wings that extend for thousands of km/s, compromising a significant fraction of the Lyman-alpha forest when present. It is therefore crucial to identify, catalog, and mask DLAs to mitigate their impact on Lyman-alpha forest clustering. This paper presents the DLA catalog strategy for the DR2 Lyα BAO measurement. The catalog is constructed using three DLA classification algorithms: the Gaussian process model from Ho et al. (2021), the CNN from Wang et al. (2022), and a spectral template DLA classifier which this work introduces. Our final DLA catalog for Lyman-alpha BAO is estimated to be 76% pure and 71% complete.

This plot shows the purity and completeness of the three DLA classifiers as a function of their respective confidence thresholds for detection. Stars indicate the choices for the Lyα BAO DLA catalog. See Figure 5 in the paper for more details.

BAO Measurements from Galaxies and Quasars & Cosmological Constraints

The rest of DESI’s BAO results come from using galaxies and quasars as tracers of large-scale structure. Cosmological constraints are then derived from the combination of these measurements with those from the Lyman-alpha forest (described above). This dataset – more than twice the size of DR1 – is the largest ever used to measure BAO. These new results provide the best measurements of the BAO scale to date, enabling precise constraints on dark energy.

DESI DR2 Results II: Measurements of Baryon Acoustic Oscillations and Cosmological Constraints

arXiv: 2503.14738

Summary: This paper presents the measurement of baryon acoustic oscillations in six different galaxy and quasar samples from the first three years of DESI observations, and explores the implications of these results for cosmology when combined with the CMB, supernovae and weak lensing. The evidence for a time-evolving dark energy equation of state has increased since the Year 1 results, which is very exciting! We’ve also performed a lot of extra tests this time which make us confident that the result isn’t driven by some unknown effect in any of the data.

This figure shows how DESI DR2 BAO measurements constrain the universe’s expansion history. Measurements from the seven tracer samples are shown as colored points with error bars. See Figure 1 in the paper for more details.
Constraints on the dark energy equation of state from fits of the w0waCDM model to DESI DR2 in combination with CMB alone and CMB with three supernovae datasets.

Validation of the DESI DR2 Measurements of Baryon Acoustic Oscillations from Galaxies and Quasars

Corresponding author: Uendert Andrade

arXiv: 2503.14742

Summary: The DESI DR2 BAO analysis significantly improves constraints on cosmic expansion by leveraging a larger dataset of galaxies and quasars compared to DR1. Our results confirm the robustness of BAO as a standard ruler and achieve a factor of ~2 improvement in precision, reducing statistical uncertainties to ~0.24%. A key plot (below) showcases the stability of BAO constraints across different data vectors and modeling choices, ensuring the reliability of our findings for cosmological inference.

Extended Dark Energy analysis using DESI DR2 BAO measurements

Corresponding author: Kushal Lodha

arXiv: 2503.14743

Summary: In this paper, we perform an extensive analysis of dark energy using the latest DESI data, combined with CMB and SN Ia observations. Using a variety of parametric and non-parametric methods, our results indicate that extending the standard ΛCDM model with a two-parameter w(z) sufficiently captures trends in the current data. The evidence for dynamic dark energy, especially at low redshift (z<0.3), is robust across various methods.

The comparison of Gaussian Processes reconstruction of the dark energy equation of state w(z) with the w0wa parameterization using DESI, CMB, and Union3 data is shown in the figure below. See Figure 10 in the paper for more details.

Constraints on Neutrino Physics from DESI DR2 BAO and DR1 Full Shape

Corresponding author: Willem Elbers

arXiv: 2503.14744

Summary: We have pushed measurements of the Universe’s most elusive particles—neutrinos—to new limits by analyzing the positions of millions of galaxies. The results indicate that the combined mass of all three neutrino types is less than 0.0642 electron volts—a value that creates tension with the lower limit of 0.059 eV established by laboratory experiments. Statistical methods surprisingly indicated physically impossible negative masses, pushing the tension to a significance of 3σ. When allowing for evolving dark energy, the tension disappeared with a revised upper limit of 0.163 eV—potentially signaling new physics beyond the standard cosmological model.

Data Release 1 (DR1)

In addition to the papers described above, DESI’s first year data release (DR1) is now publicly available. The corresponding paper below provides an in-depth overview of this release.

The seven categories in which DESI DR1 results are organized, placing Data Release 1 in context of previous cosmological results. Credit: Gustavo Niz and Alejandro Aviles

Data Release 1 of the Dark Energy Spectroscopic Instrument

arXiv: 2503.14745

Summary: This paper describes DESI public Data Release 1, covering the first year of DESI main survey observations and a consistent reprocessing of Survey Validation data previously released in the Early Data Release. DR1 includes high-quality redshifts for 18.7M objects, of which 13.1M are spectroscopically classified as galaxies, 1.6M are quasars, and 4M are stars.

This figure shows a slice of the universe mapped by the DR1 data, showing the four major galaxy samples. See Figure 1 in the paper for more details. Credit: Claire Lamman

Filed Under: blog, feature on homepage

Lawrence Berkeley National Laboratory, 19 March 2025

Filed Under: press releases

Lawrence Berkeley National Laboratory, 19 March 2025

Filed Under: press releases

What is your position or role in the DESI project?
I am a postdoctoral researcher in large-scale structure and observational cosmology, and one of the leads for the photometric redshift topical group (more on that below!), and a member of several committees that provide resources to early career researchers and underrepresented groups in science.

Where were you born?
I was born and raised in a suburb near Houston, in Friendswood, Texas – in close proximity to the NASA Johnson Space Center!

Where do you live now?
I live in Princeton, New Jersey.

What do you do as part of DESI?
Among the many incredible things DESI can measure for a galaxy, one we can get with very high precision is the redshift. When electrons in atoms are excited, they absorb and release light at very specific energies that are known from laboratory experiments. In a spectrum, this looks like ‘line’-like features at a given wavelength, and DESI observes many of these at once — telling us about the composition and physics happening inside that galaxy.

We also live in an expanding universe where galaxies are receding away from us very quickly — more quickly with greater distances. Those known atomic transition features in light from a galaxy get pulled to redder wavelengths if they’re moving away from us. Measuring the exact amount of this reddening, redshift, allows us to map galaxy distances and, with enough galaxies, large-scale structure in the universe. In the photometric redshift group, we use these precise distances from DESI to learn more about the distances to galaxies that DESI can’t observe and extend that understanding of large-scale structure to the fainter universe. Part of this includes picking targets to observe that best help us disentangle the relationship between galaxy colors and distance. I work at the intersection of spectroscopic and imaging surveys, pairing these distances with galaxy shapes to learn about our cosmic web.

What is the most interesting or exciting thing about your job?
Observations on this scale are an incredibly powerful probe of cosmology and help us better understand the constituents of our universe. Constraining different models of dark energy and dark matter, learning how the massive structures shaping our reality have evolved over billions of years — it’s all very exciting! With the biggest and most advanced observatories ever constructed coming online it is a fortunate time in history to be a curious person looking up.

Any advice for an aspiring scientist?
I think there is a large pressure on young people to pick a path quickly, at a time when they know the least about that path that they ever will. Especially for people who don’t see themselves represented in science today, this can lead to self-rejection from what might otherwise be an incredible aptitude and curiosity. I would encourage anyone aspiring to work in science to appreciate that everyone starts from knowing nothing, and the only remedy is asking questions and gaining the tools to answer them. The only unteachable skill is curiosity, and the rest you’ll learn in time if you have the initiative.

What do you do for fun?
I really enjoy playing soccer, creating digital art, and writing speculative fiction.

What excites/interests you most about DESI?
The Dark Energy Spectroscopic Instrument is the first massively multiplexed spectroscopic telescope, ushering in a wave of others (e.g., 4MOST, PFS). This means that it is capable of observing as many as five thousand galaxies at once. Recent pilot studies have shown that DESI is also capable of observing incredibly faint galaxies as efficiently as much larger telescopes. I’m very excited for the potential of a large faint sample of DESI galaxies, telling us about galaxy evolution, their interactions with one another, and the growth of cosmic structure.

Filed Under: meet a DESI member

Sam Brieden (middle) with his PhD advisors Héctor Gil-Marín (right) and Licia Verde (left) after pitching the blinding methodology at the Berkeley 2019 DESI collaboration meeting.

Joan Najita (NOIRLab)

10 March 2025

“Perhaps only in a world of the blind will things be what they truly are.” — José Saramago, Blindness

We’re all human. Science is a human endeavor, carried out by humans with all their imagination, creativity…and biases. Sometimes we explore the Universe without expectations, but often we have an idea of what we may find (a hypothesis, a hunch). These ideas motivate and guide us in our exploration. But they can also introduce confirmation bias, “the tendency to process information by looking for, or interpreting information that is consistent with…existing beliefs.” (Britannica). In its quest to make precision cosmological measurements, DESI uses a process called “blinding” in its analysis methodology in order to avoid the inaccuracies that can arise from confirmation bias.

We sat down with DESI scientists Sam Brieden (U. Edinburgh), Uendert Andrade (U. Michigan), and Juan Mena-Fernández (LPSC, Grenoble) to learn about how blinding works, the rationale behind it, and what it’s like to work this way.  

Q: What is the general purpose of blinding in research?

Sam: Research is never carried out in a vacuum, it is always bound to existing knowledge and expectations. Every researcher or group of researchers is subject to external influences that may affect the way an analysis is performed. For example, a new analysis result that is in agreement with current consensus and does not contradict any prior results, is more likely to be accepted by the community. On the other hand, if a new result is unexpected, it is more likely to raise eyebrows. Due to this “pressure”, researchers unconsciously tend to examine unexpected results more closely and, say, include more cross-checks and caveats, or a less optimistic error estimation. In other words, there is a trend in research that expected results tend to be treated with less scrutiny than required, while unexpected results may be tweaked until they agree better with expectations. In “The Neglect of Experiment,” Allan Franklin describes the process this way:

“Although each experiment was honestly made, they were, except for the first, conducted in light of previous results. In any experiment, the sources of error, particularly systematic error, may be hidden and subtle. This is particularly true of…technically difficult experiments. The question of when to stop the search for sources of error is then very important. One psychologically plausible end point is when the result ‘seems’ right.”

This phenomenon can lead to a so-called “confirmation bias”, the trend that research results are likely to align with previous results, even though they might be wrong. Carrying out a blinded analysis, where the actual research results are “hidden” from the researcher until all the analysis choices have been made, is an effective way to shield oneself from that sort of bias.

Therefore, more and more natural science branches routinely adopt blinding strategies to reduce confirmation bias in an optimal way.

Q: What is special about the way DESI incorporates blinding in its analysis methodology?

Uendert: DESI employs a unique blinding strategy that is intricately designed to mitigate experimenter bias while ensuring the integrity of the analysis. In broad strokes, there are three steps: (1) We first create data that’s plausible but shifted away from the truth. (2) We then refine our analysis method by working with this ‘’test’’ data. (3) When we’re done, we apply the analysis method to the real data — in a step called “unblinding”, i.e., the “big reveal” — and no further changes are allowed.

Thus, we are masking the truth at the data level. In the first step, creating the test data, we start with the real data and shift galaxy positions along the line-of-sight to mimic a different, randomly selected  cosmological model, thus preserving the statistical properties of the data. Such a comprehensive approach is tailored therefore to DESI’s specific observables (baryon acoustic oscillations and redshift-space distortions) and represents a significant step forward in the practice of blinding in cosmology, especially in the context of large spectroscopic surveys.

Q: What is it like to do the analysis “blind”? (is it disorienting? liberating? or pretty much like normal research?)

Juan: I must say blinding felt a bit weird to me at the beginning of my PhD. Depending on the methodology adopted for blinding, you might not be allowed to see the data at all. And sometimes, you might be allowed to measure things on the data, but not to look at the results (which you might really want to look at!). However, after several years working in large collaborations, now it feels like a part of the process of doing science.

Uendert: Working with blinded data can feel both liberating and challenging. On the one hand, it frees researchers from preconceived notions about the results, encouraging a more objective and unbiased analysis. On the other hand, it requires a strong trust in the analysis pipeline and the blinding process itself, for which we have to creatively design tests and then carry them out. The anticipation of discovering the true cosmological parameters after unblinding adds an exciting layer of mystery to the research.

Q: What is it like to experience the “unblinding”? Is it exciting? What emotions do you have?

Juan: I have experienced several unblindings, and these are always extremely exciting. The unblinding is typically done in a video call meeting in which everyone in the collaboration can connect, and so there are a lot of people watching. This usually makes me feel nervous, especially if I’m deeply involved in the analysis (partly because the analysis could have taken months or even a year to carry out). There are lots of things to prepare for an unblinding, such as slides to present the project and scripts that will create the unblinded plots and output the results. The most exciting part is that moment in which you press the button to run your script and obtain the final unblinded measurement!

Uendert: For me, as you might imagine, the moment of unblinding is filled with a mix of excitement, anticipation, and a bit of nervousness. It’s the culmination of years of hard work, and there’s a tangible sense of revealing the Universe’s secrets. The experience is akin to opening a highly anticipated gift; you’re eager to see what’s inside but also hoping it meets your expectations. Regardless of the outcome, it’s a pivotal moment that deepens our understanding of the cosmos.

Sam: I was really excited in anticipation of the internal full-shape unblinding event on 12 June 2024 — which revealed the results that were eventually published on 19 November 2024 — since I developed both the Blinding and the full-shape (i.e., ShapeFit) methodologies during my PhD. Coincidentally, my wife and I were expecting a child, and we went to hospital on the same day, so I missed the DESI unblinding in favor of another (and for me personally even more exciting) unblinding event!

Q: What aspect of the DESI results are you looking forward to next?

Juan: I’m always looking forward to seeing the constraints in cosmological parameters inferred from the data, in DESI or in any other experiment.

Uendert: I’m particularly looking forward to seeing how the DESI results will refine our understanding of the dark energy equation of state and its potential evolution over cosmic time. The scale and precision of DESI’s dataset offer an unprecedented opportunity to probe the dynamics of the Universe’s expansion and the nature of dark energy. This could lead to groundbreaking insights into one of the most profound mysteries in cosmology.

Filed Under: blog, feature on homepage

Caption: A foreground cluster of (large, yellowish) galaxies gravitationally lenses the light from background galaxies, creating distorted linear features and arcs. (Image credit: NASA/ESA/J. Lotz STScI)

Cosmological measurements often make use of fun and interesting ideas that depart from our everyday experience. Here cosmologist Jamie McCullough explains and helps us visualize several of the concepts involved in plans to measure the distribution of dark matter in the universe and probe the growth of cosmic structure over time.

by Jamie McCullough

26 February 2025

When DESI measures the spectrum of light from a galaxy – i.e., the intensity of light as a function of wavelength or energy – we learn a lot about the physics of what is happening both inside the galaxy and in the space between the galaxy and us.

A particularly important property we can measure is a galaxy’s redshift. As galaxies recede from us in an expanding universe, their light is pulled to less energetic wavelengths, or redshifted, by the same doppler effect that makes train whistles pitch low as they travel away from us. In an expanding universe, more distant objects are redshifted more than nearby objects. As a result, if we know how the universe is expanding, we can learn the distance to the galaxy from a measurement of its redshift. With the ability to measure the spectra of as many as 5000 galaxies at a time, DESI is uniquely suited to measuring the distances to galaxies across the night sky and thereby mapping the visible universe. You can see redshift in action for a galaxy in the figure below. Here the vertical dashed line marks a bright emission line of oxygen in star-forming galaxies. The number in the upper left corner is the redshift z = v/c where v is the recession velocity and c is the speed of light.

As a galaxy’s redshift z increases, its emission lines are shifted to longer wavelengths. (Credit: Jamie McCullough)

However, the visible universe accounts for only a small fraction of the matter we know exists. The vast majority doesn’t interact with light in any known way – it’s dark matter. The spatial distribution of this dark matter is of great interest, because it drives the movement of galaxies in the universe. Mapping the dark matter — which is thought to be arranged in long filaments, i.e., in a dark cosmic web — requires more information than DESI alone can provide. If we combine the galaxy distance measurements from DESI with the measurement of galaxy shapes from imaging surveys (like, for example, the Dark Energy Survey (DES), the Kilo-Degree Survey (KiDS), and the Hyper Suprime-Cam (HSC) survey), we can map the dark structure using a method called weak gravitational lensing. This method relies on an effect from general relativity that massive objects warp the geometry of space and time. As a result, an image of a distant galaxy will be distorted as light from the galaxy passes massive objects on its way to us.

To understand how weak lensing works, we can first look at the case of a more straightforward example. In what’s called “strong lensing,” we can readily see this warping in action, as we find images of background galaxies stretched and distorted tangentially around a very massive foreground object like a galaxy cluster. This stretching is very similar to the optical effect you might see looking through the thick base of a wine glass. With a thicker piece of glass we see more refraction, just as we see more distortion behind more massive galaxy clusters. You can see this effect in the simulation below and in this other simulation, in which a moving massive galaxy passes first in front of a grid of shapes, and then in front of the Hubble Deep Field. We see that these strong lenses can stretch a background galaxy’s light into continuous rings called “Einstein rings”. They can even produce more than one image of the same background galaxy! What happens all depends on how the background and foreground objects line up.

In strong lensing, images of background objects are stretched tangentially around massive foreground objects. (Credit: Jamie McCullough)

However, the typical (weak lensing) distortion that a galaxy’s light experiences on its way to us is not as dramatic as in the above examples. Warping from large-scale structure changes galaxy shapes much less, on the order of a mere percent. As we can see in the prior simulations, the amount of distortion depends very strongly on the distance to the background object and to the lensing structure, so understanding those distances is crucial. We expect that if we measure enough of these galaxy shapes and their correlations with one another, we can trace those dark cosmic filaments dominated by dark matter. You can see a toy model of weak lensing below, where a hypothetical background grid of perfect circles becomes displaced, magnified, and sheared about the hidden structure shaded in blue.

A toy model of weak lensing, in which a background grid of circles is displaced and sheared about foreground hidden structures (shown in blue). (Credit: Jamie McCullough)

If we measure the distances and observed shapes of these galaxies and correlate them with one another, we can devise a relationship for how alike any two shapes are as a function of their separation (𝜉±). With these weak gravitational lensing measurements and different cosmological models, we can find the one that best explains our observations and produces constraints on how clumpy our universe is (as measured by a quantity called S8) and how much matter there is in the universe (as measured by a quantity called 𝛺m).

By comparing measurements of weak lensing (blue points) with the predictions of different cosmological models (blue line), we can constrain how clumpy our universe is. (Credit: Jamie McCullough)
By comparing measurements of weak lensing (blue points) with the predictions of different cosmological models (blue line), we can constrain the amount of matter in the universe. (Credit: Jamie McCullough)

With the incredibly precise distances we get from DESI and the increasingly precise measurements we are now getting for galaxy shapes, we can perform these lensing measurements better than ever before – making it a very promising way to probe the growth of cosmic structure over time and learn about all the contents of our universe — both the luminous and the dark!

— Edited by Joan Najita

Filed Under: blog, feature on homepage

What is your position or role in the DESI project?
I serve as one of the Working Group Chairs for the Milky Way Working Group in DESI.

Where were you born?
I was born in Shanghai, China.

Where do you live now?
I am based at the University of Toronto, so I live in Toronto, Canada.

What do you do as part of DESI?
My journey with DESI began during my postdoctoral position at Fermilab, where I worked on the focus and alignment system—an essential component for DESI’s survey commissioning and operation. I was also involved in DESI’s commissioning and science verification phases. Since the survey officially began, I have primarily contributed to the Milky Way Survey (MWS) and currently chair the MWS Working Group. In the past, I also served on the DESI Publication Board.

What is the most interesting or exciting thing about your job?
Collaborating with people from all over the world, finding opportunities for junior scientists to engage with DESI data, and then seeing their hard work culminate in a published paper a year later—it’s incredibly rewarding!

Any advice for an aspiring scientist?
Reach out to DESI members and ask your questions, especially if you’re new to the collaboration. Everyone is friendly and eager to help, and we’re always looking for people to work on DESI data. Don’t be shy—our collaboration meetings are an excellent place to connect with others and get involved!

What do you do for fun?
I love traveling around the world and trying delicious local cuisines.

If you weren’t a scientist, what would be your dream job?
At one point, I wanted to be a diplomat 🙂

What excites/interests you most about DESI?
The DESI data is revolutionary—not just for cosmology but for astronomy and astrophysics as a whole. I feel that the community is still unaware of its incredible potential because they haven’t had the chance to explore the data yet. I feel my current mission is to promote DESI within the broader astronomy community and help more people discover its amazing possibilities!

Filed Under: meet a DESI member

Caption: BaoBan appeared high atop the KPNO float at the 2025 Tohono O’odham Nation Rodeo Parade. Credit: M. Edwards
Joan Najita (NOIRLab)

20 February 2025

BaoBan, DESI’s ambassador for Education and Public Outreach, recently dropped in on this year’s Tohono O’odham Nation Rodeo Parade, greeting parade spectators from high atop the Kitt Peak National Observatory (KPNO) parade float. The DESI project is being carried out at KPNO, which is located atop I’oligam Du’ag, in the homeland of the Tohono O’odham Nation. A coyote from the wilds of Arizona, BaoBan also took a star turn at last year’s Rodeo Parade.

At this year’s parade, held on 1 February 2025 in Sells, Arizona, BaoBan appeared on the KPNO parade float alongside images of Tohono O’odham employees and those who have supported the Observatory over the past 60 years. Decorated with colorful images of stars and planets, the float joined in on the parade theme “Celebrating Our O’odham Superheroes” with BaoBan sporting his own superhero cape. NOIRLab volunteers also walked alongside the float clad in vibrant capes and masks.

Caption: NOIRLab volunteers pose with their parade entry at the 2025 Tohono O’odham Nation Rodeo and Fair. The theme was “Celebrating Our O’odham Superheroes”. From left: Jessica Harris, Carolina Vargas, Sarah Logsdon, Alice Jacques, Lori Allen, Michelle Edwards, and Jacelle Ramon-Sauberan. Credit: T. Schleicher

Now in its 86th year, the Tohono O’odham Nation Rodeo and Fair is an important tradition that celebrates Tohono O’odham culture and history. In addition to the all-Indian rodeo, the event featured live music, fairground rides, exhibitions and food booths. At the NOIRLab information booth, volunteers, including DESI astronomers, invited fair attendees to view the Sun through telescopes and to visit Kitt Peak to learn more about projects such as DESI. A special thanks to BaoBan and all volunteers for their help making this event a “super” success!

Caption: At the NOIRLab booth, DESI astronomer Arjun Dey helps a young visitor check out the Sun. Credit: J. Najita

Filed Under: blog, feature on homepage

What is your position or role in the DESI project?
I am a postdoc, and within DESI, I co-lead the galaxy lensing topical group.
 

Where were you born?
I was born in Vilnius – the capital of Lithuania, which is a small country in Europe, next to the Baltic Sea.
 

Where do you live now?
I currently live in Melbourne, Australia.
 

What do you do as part of DESI?
My involvement in DESI is focused on working towards combining it with photometric weak lensing surveys. The weak lensing surveys measure how much the observed shape of galaxies is bent by the structure (foreground galaxies) that the emitted light travels trough to reach us. DESI is a great probe of such foreground structure and so the two types of measurements are complimentary. In my own research I am most interested in finding ways to consistently perform such combined analyses while making use of the full information of the two point galaxy clustering measurements and meaningfully interpret the resulting cosmological constraints. As a co-lead of the galaxy lensing topical group I am responsible for overseeing the different analyses that test a range of models and assumptions needed for a successful combination of the two different types of observations.
 

What is the most interesting or exciting thing about your job?
I love hearing new perspectives on familiar concepts that deepen my understanding and allow me to see how these concepts fit in the bigger picture in a more cohesive way. I also always appreciate all the creative ways that people solve difficult problems. In any kind of combined analysis one usually needs a lot of expertise and imagination to bring together the separate approaches that might have originally been very different from each other. I am always so impressed by the way my colleagues solve these problems and I am very grateful to be learning from them!
 

Any advice for an aspiring scientist?
My most generic advice is to try and make sure that the choices you make reflect the things you enjoy, whether it is the topic you are passionate about or inspirational people you want to learn from. While there are many frustrating moments in science, it is important that, overall, the process towards completing a research project is in itself interesting and rewarding – and don’t forget to celebrate the little wins along the way! My second piece of advice is to not let the image of what other scientists are like determine what you are supposed to be like to be successful. It is great to get inspiration and guidance but, most importantly, find what works for you.
 

What do you do for fun?
I enjoy going to galleries and concerts, trying out different coffee, exploring new places. I also love swimming and after moving to Melbourne I’ve started learning rowing as well, which has been so much fun and so rewarding!
 

If you weren’t a scientist, what would be your dream job?
I think I might quite enjoy doing a different creative job – I used to write a lot in school and I would love to go back to that. In university I used to work at a coffee shop in an art gallery which combined two of the things that bring me much joy, so perhaps a barista-gallery curator would be another fun occupation!
 

What excites/interests you most about DESI?
The shear size of the dataset is so impressive – comparing it with the previous galaxy surveys and seeing how far we have come from the first clustering observations is truly awesome. The fact that we are also able to model the distribution of all these galaxies and use that to understand our Universe never ceases to blow my mind, it is such an incredible example of what humans can achieve when working together!
 

Filed Under: meet a DESI member

Supermassive black holes are found at the centers of almost all massive galaxies. Credit: NSF/AUI/NSF NRAO/S.Dagnello

Joan Najita (NOIRLab)

8 February 2025

One of the remarkable things we’ve learned about galaxies over the past few decades is that they often come with a special surprise in the middle — a huge black hole. Weighing in at more than a million times the mass of the Sun, these “supermassive black holes” are found at the centers of almost all galaxies similar to or more massive than the Milky Way. Why do galaxies have these black holes? And how did they get there? Do much lower mass galaxies also have central black holes? These questions have motivated the search for black holes in low-mass “dwarf galaxies,” systems that may provide vital clues regarding the origin of black holes in the Universe.

A recent paper, led by Ragadeepika Pucha (U. Utah), takes a big step in this direction. Analyzing DESI spectra of dwarf galaxies, the researchers identified candidate black holes that are actively accreting matter from their surroundings. The feeding process produces a characteristic spectrum of bright atomic emission lines that the researchers used to identify these systems as Active Galactic Nuclei (AGN). The study detected AGN signatures in over 2000 dwarf galaxies, more than tripling the number of known dwarf galaxies with candidate black holes. The detections, which extend to lower galaxy masses and higher redshifts (i.e., further back in time) than previously probed, suggest that black holes may commonly exist even in these very low-mass galaxies.

We sat down with Raga to learn more about this remarkable result.

A montage of dwarf AGN candidates studied in Pucha et al. (2025), created using the Legacy Survey Sky Viewer and images from the Subaru Telescope’s Hyper Suprime-Cam. Each image is 30 kpc on a side.

Questions for Raga:

Q: Why was it important to increase the census of dwarf AGN? Was this difficult before DESI?

A: Dwarf galaxies are the most abundant galaxies in the Universe, and understanding their growth is crucial for piecing together the puzzle of galaxy formation and evolution. Because their lower mass (and therefore lower gravity) makes it more challenging for them to hang on to their gas, the energy output from the AGN, which can eject gas from a galaxy, can potentially have a major impact on a dwarf galaxy’s ability to continue to form stars. What happens exactly remains an open question. To explore this complex interplay between dwarf galaxy evolution and black hole evolution, we first need to establish a robust statistical sample of dwarf AGN candidates.

Historically, this has been a real challenge. Because low-mass galaxies are faint, it has been difficult to measure the spectra of a large sample and identify dwarf AGN candidates. But DESI is changing the landscape with its ability to measure spectra of many objects simultaneously. The early DESI data included spectroscopy of nearly 115,000 dwarf galaxies, from which we uncovered the largest sample of dwarf AGN candidates to date. Part of the success is the result of the smaller fiber size of DESI, which makes it easier to  focus on the light from the central region of the galaxy, where the AGN is, and ignore the starlight from the rest galaxy. As a result, we were able to identify fainter dwarf AGN candidates than in previous studies.

Q: It looks like you find that dwarf galaxies also commonly host black holes. Do these results tell us anything about the origin of supermassive black holes in general?

A: A major question about supermassive black holes is how they formed. What mass did the black hole start out with? What was its “seed” mass? Because lower mass galaxies are likely to harbor lower mass black holes, they may provide a bridge between stellar mass black holes (< 100 solar masses) — which are familiar to us from X-ray binaries and LIGO gravitational wave sources — and supermassive black holes at the centers of large galaxies. These “intermediate mass black holes”, while elusive to date, are theorized to be the “seeds” of supermassive black holes and the relics of the first black holes formed in the Universe.

With DESI, we’ve found the lowest mass black holes in galaxies to date. Since black holes can only grow over time and cannot disintegrate into smaller ones, these findings suggest that the black holes we are observing may be analogs of the primordial black holes that formed in the early Universe, i.e., the “seed black holes” of supermassive black holes. A very small number of our sources may even be primordial black holes, having persisted through the ages with little to no evolution.

Q: What do you find most interesting about the results?

A: We find that nearly 2% of dwarf galaxies host active black holes, a significant increase compared to the ~0.5% reported in earlier studies. This is an exciting result, as it suggests that we have been missing a substantial number of undiscovered black holes. It opens the possibility that even more black holes are concealed within these low-mass galaxies.

The ability to detect an active black hole depends on several factors, including the black hole’s mass, the availability of gas in its vicinity, the accretion rate, and the sensitivity of the instruments used to detect the emission from the resulting AGN. As a result, for a given galaxy mass, the black holes we observe will tend to be either the most massive or those with the highest accretion rates, depending on the specific telescope and instrument used.

Our findings show that the fraction of galaxies hosting actively accreting black holes increases with galaxy mass, reaching nearly 100% for the most massive galaxies. This suggests that when a massive galaxy has an active black hole, it is readily detected by DESI. In contrast, in lower-mass galaxies, the emission from ongoing star formation can mask or dilute the AGN signal, making it harder to detect their faint AGN. This does not imply that low-mass, star-forming galaxies do not host black holes, but rather that we are currently identifying all the actively accreting black holes that are detectable with our instruments.

Q: What drew your interest to this topic?

A: When I began my PhD, my primary goal was to delve into the field of galaxy formation and evolution. I was particularly drawn to dwarf galaxies, as they are the most common kind of galaxy in the universe, yet they remain poorly understood. What are their histories? Do they follow the same evolutionary path as more massive galaxies? Or does the energy released by their active black holes (if they have one) play a significant role in shaping their growth?

By sheer coincidence, my advisors, Stephanie Juneau and Arjun Dey, encouraged me to join the DESI collaboration, which turned out to be the perfect opportunity to dive deeper into this research. They were incredibly supportive of the idea to use DESI data to search for dwarf AGN candidates as a first step in understanding the evolution of dwarf galaxies in the universe.

An unexpected bonus was realizing that this project also ties into one of the most fundamental and exciting questions in present day astronomy: the formation of supermassive black hole seeds. The chance to simultaneously explore the evolution of dwarf galaxies and the origins of supermassive black holes has been deeply motivating. The interconnection between these two lines of inquiry, and the potential to advance our understanding on both fronts, has been a truly rewarding aspect of my research journey.

Q: What’s next for you?

A: With the largest sample of dwarf AGN and IMBH candidates now at our disposal, we are poised to tackle some of the most pressing questions in the study of supermassive black hole seed formation and the co-evolution of dwarf galaxies and their central black holes. My upcoming projects will focus on examining the relative effects of AGN versus star-formation feedback in dwarf galaxies, exploring the energetics related to these feedback mechanisms, and characterizing the population of dwarf AGN candidates identified through multi-wavelength and multi-diagnostic approaches.

My DESI collaborators and I also plan to investigate the demographics of these black holes, employing modeling techniques to study whether all galaxies have black holes (or what fraction do), as well as the black hole mass function in the universe. We will expand these analyses to include DESI Year 3 data, which will further enhance the scale and scope of our research.

Filed Under: blog, feature on homepage

  • Go to page 1
  • Go to page 2
  • Go to page 3
  • Interim pages omitted …
  • Go to page 13
  • Go to Next Page »

Primary Sidebar

Copyright © 2018 Dark Energy Spectroscopic Instrument [DESI]

  • / science /
    • science overview
    • cosmology and dark energy
    • redshifts and distance
    • mapping the universe
    • the DESI science mission
    • the DESI survey
    • imaging surveys
  • / instrument /
    • instrument overview
    • telescope
      • tohono o’odham
    • corrector
    • focal plane system
    • fiber system
    • spectrograph
    • instrument control system
    • data systems
    • bringing DESI to life
      • commissioning Instrument
      • protoDESI
  • / collaboration /
    • DESI team
    • DESI builders
    • collaborating institutions
    • sponsors
    • code of conduct
    • vendors
    • collaboration policies
  • / press /
    • announcements
    • in the news
    • press releases
    • tweets by desisurvey
    • blog
    • acknowledgments
  • / galleries /
    • videos
    • image gallery
  • / for scientists /
    • data releases
    • instrument design
    • imaging data
    • target selection and survey validation
    • theory and simulations
    • other DESI science
    • key publications
    • all DESI papers
    • team login
    • request a DESI speaker
    • internal
  • / education & outreach /
    • meet a DESI member
    • blog
    • planetarium show
    • DESI high
    • interactive visualizations
    • DESI Merch

Footer

TEAM LOGIN

twitter   instagram   facebook

Copyright © 2018 Dark Energy Spectroscopic Instrument [DESI]

Copyright © 2025 · Parallax Pro DESI on Genesis Framework · WordPress · Log in