Anand Raichoor and Christophe Yeche
August 22, 2022
We are glad to announce the publication on arXiv on Friday, August 19, 2022 of eight papers from Year 1 Key Project 1 (Y1KP1). These papers describe:
- how the DESI Main Survey targets are selected, along with their photometric and main spectroscopic properties (MWS: Cooper et al. 2022, BGS: Hahn et al. 2022, LRG: Zhou et al. 2022, ELG: Raichoor et al. 2022; QSO: Chaussidon et al. 2022);
- the pipeline to process those targets for DESI observations (Myers et al. 2022);
- the building of redshift truth tables based on visual inspections (Lan et al. 2022, Alexander et al. 2022).
Targets are selected from the Legacy Survey DR9 photometric catalogs, which are derived from three optical imaging surveys in the grz-bands—primarily assembled for that exact purpose, completed with the near-infrared WISE and the Gaia data.
They summarize the long-term effort by many researchers from the DESI collaboration to design a key part of the DESI experiment. All the different algorithms were tested and optimized during the Survey Validation (SV). At the end of the first part of the SV, the team has provided a final version of the target selection for all the tracers. They were finally validated during the One-Percent Survey.
With this target selection work coming to an end, the effort is now focusing on participating in the preparation of the large-scale structure analysis of the first year of data.
A second batch of papers will be published on arXiv in the coming months, prior to the SV data release…so stay tuned!



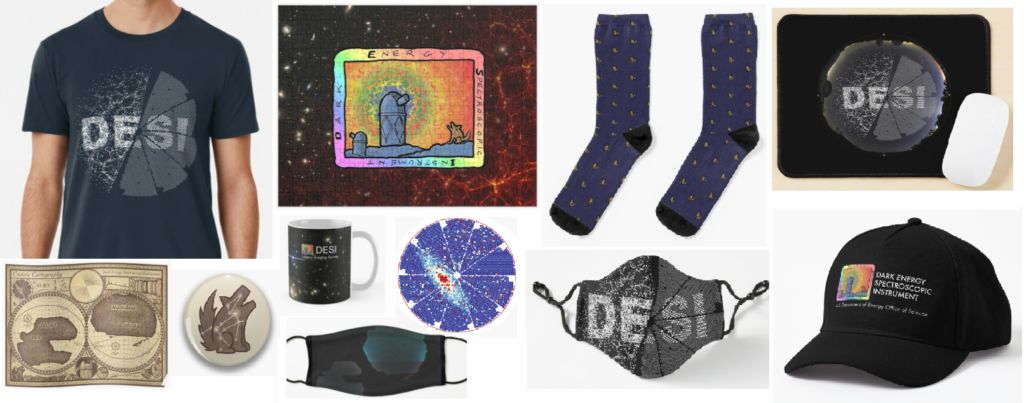
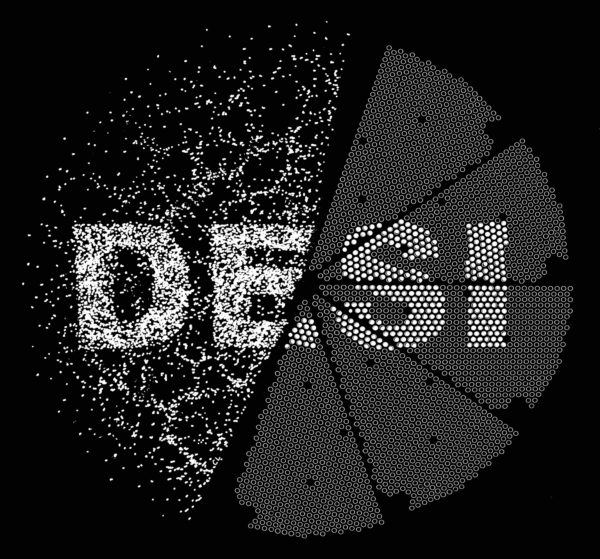 In honor of the opening of our online shop, I made a special DESI-gn that highlights both the science and instrumentation parts of our collaboration. “Dark Energy” is represented by a map of large-scale structure, and “Spectroscopic Instrument” is represented by our focal plane and its 5,000 robotic positioners.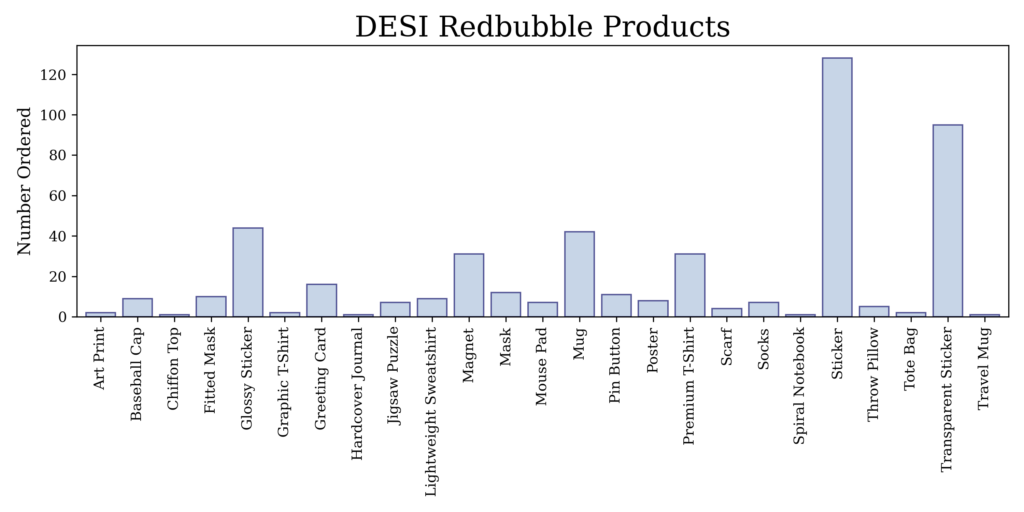
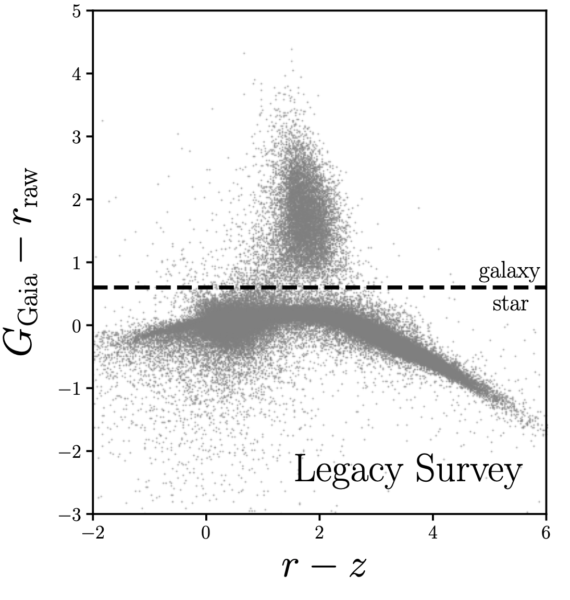
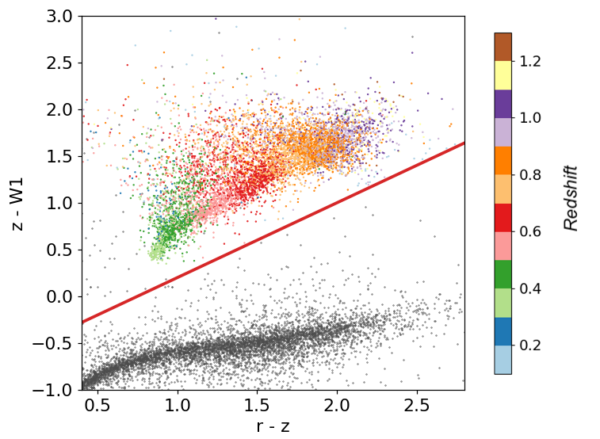 LRG selection is done by the cut (red line) in the (r – z) – (z – W1) space. This selection uses the W1 infrared band to separate galaxies (color points) from stars (grey points). The different colors show the redshift of the galaxies in the color–color space. This selection will observe ~615 targets per square degree. (See Zou et al., in prep.)
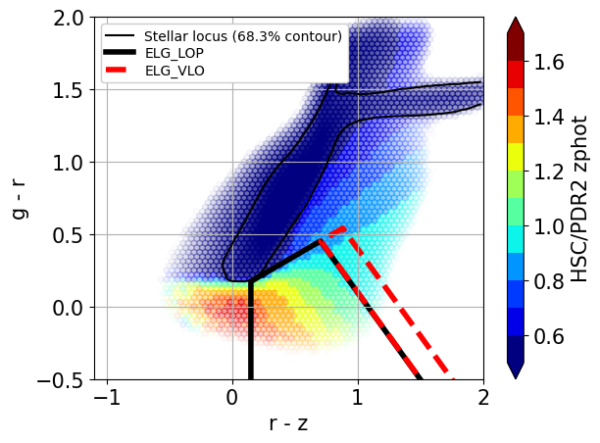 To avoid stellar contamination (black smooth line) in the target selection, ELG selection uses a cut in (r – z) – (g – r) space. The color histogram is the redshift distribution of ELGs in the color space. This selection will observe ~2,387 targets per square degree. (See Raichoor et al., in prep.)
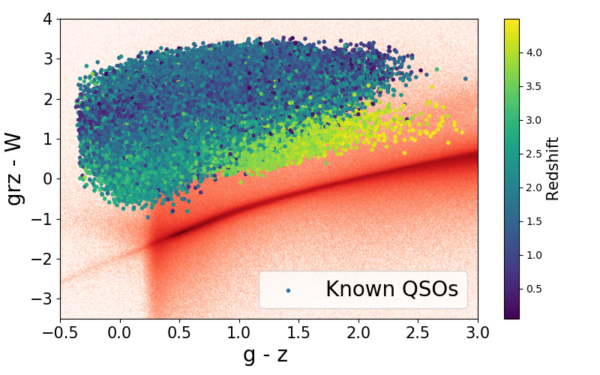 Only point sources are considered during the selection and the target selection aims to separate quasars from stars. However, the separation between these two classes is less obvious than in the previous cases. A more sophisticated selection has to be applied. Quasars are selected via a Random Forest classification instead of the classical color cuts selection done in previous spectroscopic surveys. The idea of the selection is to separate quasars from stars based on the “infrared excess” of QSOs. The stellar locus is illustrated by the red line and the quasars by the blue/green/yellow points. This selection will observe ~308 targets per square degree (see Chaussidon et al., in prep.).