• Skip to main content
  • Skip to primary sidebar
  • Skip to footer

Dark Energy Spectroscopic Instrument (DESI)

  • / science /
    • science overview
    • cosmology and dark energy
    • redshifts and distance
    • mapping the universe
    • the DESI science mission
    • the DESI survey
    • imaging surveys
  • / instrument /
    • instrument overview
    • telescope
      • tohono o’odham
    • corrector
    • focal plane system
    • fiber system
    • spectrograph
    • instrument control system
    • data systems
    • bringing DESI to life
      • commissioning Instrument
      • protoDESI
  • / collaboration /
    • DESI team
    • DESI builders
    • collaborating institutions
    • sponsors
    • vendors
    • diversity, equity, and inclusion
    • collaboration policies
  • / press /
    • announcements
    • in the news
    • press releases
    • blog
    • tweets by desisurvey
    • acknowledgement statement
  • / galleries /
    • image gallery
    • videos
  • / for scientists /
    • instrument design
    • imaging data
    • target selection and survey validation
    • theory and simulations
    • other DESI science
    • all DESI papers
    • team login
    • request a DESI speaker
    • internal
  • / education & outreach /
    • meet a DESI member
    • blog
    • planetarium show
    • DESI high
    • interactive visualizations
    • swag shop

DESI begins its “1% Survey”

April 28, 2021 by

Daniel Eisenstein, Harvard University
April 28, 2021

On April 5, 2021, DESI turned to the second and final phase of its Survey Validation (SV) work, the so-called “1% survey”.  Whereas the first phase of SV was aimed at getting long and definitive observations of a broad superset of the planned spectroscopic targets, the 1% survey aims to demonstrate that we can operate the facility in a model closely matched to that planned for the 5-year survey.

The 1% survey is being conducted with target selection similar to what is planned for the main survey and with exposure times only mildly longer.  Importantly, we aim to observe each region of sky more times than in the main survey so that we achieve a higher fiber-assignment completeness, the fraction of targets that are assigned a fiber.

A single exposure with DESI provides about 600 fibers per square degree, but the survey target lists contain about 3500 targets per square degree for the dark/grey conditions (when the moon is small or set) and about 2000-2500 targets per square degree for bright conditions (when the moon is fuller).  In the main survey, we will return to a point on the sky numerous times to observe about 80% of the targets, but allowing some incompleteness so that we can efficiently move on to new regions.  In the 1% survey, we plan to return to each region at least 10 times for dark-time targets and 8 times for bright-time targets, each with a distinct target list, so as to observe all but a few percent of the targets.

So far, we have started observations on 16 regions, each 7 square degrees and each including both dark-time and bright-time targets.  We expect to finish this program in May.  With this data set, we will be able to get a first estimate of the 3-dimensional clustering of the galaxy and quasar samples, which will then allow the collaboration to tune the models of simulated galaxy positions in our cosmological mock catalog.

With the observations moving at normal survey pace from one target set to the next, the rate of gathering new redshifts has increased dramatically.  In the first 8 nights, we acquired over 400,000 separate successful redshift measurements of 350,000 unique sources.

DESI Collaboration. Daniel Eisenstein (Harvard University)

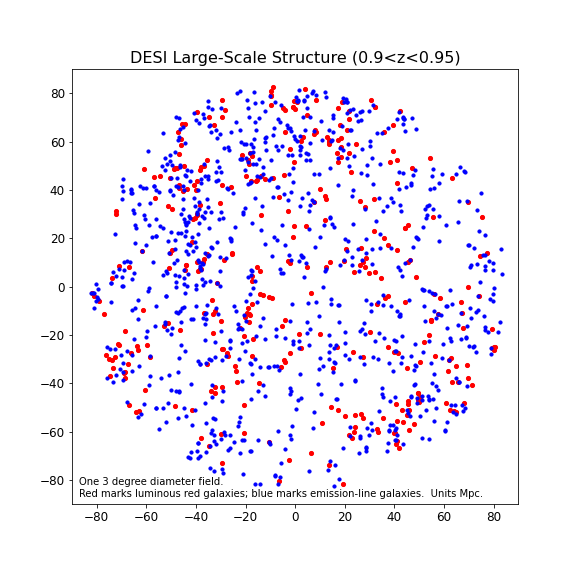
The plot shows a visualization of one of the 16 regions, which has 13 dark-time visits, showing a map of the galaxy locations in Mpc on the plane of the sky.  Only galaxies between redshift 0.90 and 0.95 are shown, with the luminous red galaxy targets plotted in red and the emission-line galaxy targets in blue.  One can see the cosmic web of large-scale structure, with walls, filaments, and voids, as well as the tendency of red galaxies to cluster together more than blue galaxies.  This is about 1 part in 20,000 of the final survey size!

Filed Under: blog, feature on homepage

Primary Sidebar

  • Sneaking around with DESI data
  • Lightning and a lunar eclipse over Kitt Peak
  • Untangling the Cosmic Web
  • Recovery effort update two months after the Contreras Fire
  • First batch of Year 1 Key Project 1 papers
  • Contreras Fire Threatens DESI and Kitt Peak National Observatory
  • One Year and 12.8 Million Galaxy Redshifts
  • DESI on a T-shirt (and stickers of course!)
  • Selecting Targets for the DESI Survey
  • The Old is New Again: Social Distancing While Mapping the Universe
  • Congratulations to Frank Valdes
  • The DESI peculiar velocity survey
  • DESI Breaking Records
  • A DIY Guide for Upgrading Your 100 Million Dollar World Class Astronomical Instrument
  • An Upgraded DESI Returns to the Sky
  • Cosmic Cartography
  • Diversity of DESI SV Quasars
  • The Beginnings of the 3-Dimensional Map
  • What do DESI’s 5000 eyes see?
  • Plugging Away
  • DESI Begins Search for Elusive Dark Energy
  • DESI begins its “1% Survey”
  • DESI Embarks on Survey Validation
  • An Undergrad Perspective on DESI
  • Women in DESI on International Women’s Day
  • Hunting the Oxygen Doublet in Distant Galaxies
  • Congratulations to David Weinberg
  • DESI Imaging Leaves a Legacy at Infrared Wavelengths
  • DESI Target Selection
  • DESI Successfully Completes Commissioning Phase

Footer

TEAM LOGIN

twitter   instagram   facebook

Copyright © 2018 Dark Energy Spectroscopic Instrument [DESI]

Copyright © 2023 · Parallax Pro DESI on Genesis Framework · WordPress · Log in