• Skip to main content
  • Skip to primary sidebar
  • Skip to footer

Dark Energy Spectroscopic Instrument (DESI)

  • / science /
    • science overview
    • cosmology and dark energy
    • redshifts and distance
    • mapping the universe
    • the DESI science mission
    • the DESI survey
    • imaging surveys
  • / instrument /
    • instrument overview
    • telescope
      • tohono o’odham
    • corrector
    • focal plane system
    • fiber system
    • spectrograph
    • instrument control system
    • data systems
    • bringing DESI to life
      • commissioning Instrument
      • protoDESI
  • / collaboration /
    • DESI team
    • DESI builders
    • collaborating institutions
    • sponsors
    • code of conduct
    • vendors
    • collaboration policies
  • / press /
    • announcements
    • in the news
    • press releases
    • tweets by desisurvey
    • blog
    • acknowledgments
  • / galleries /
    • videos
    • image gallery
  • / for scientists /
    • data releases
    • instrument design
    • imaging data
    • target selection and survey validation
    • theory and simulations
    • other DESI science
    • key publications
    • all DESI papers
    • team login
    • request a DESI speaker
    • internal
  • / education & outreach /
    • meet a DESI member
    • blog
    • planetarium show
    • DESI high
    • interactive visualizations
    • DESI Merch

DESI 2024 Supporting Papers: June 11 Guide

June 11, 2024 by sambrieden

sambrieden

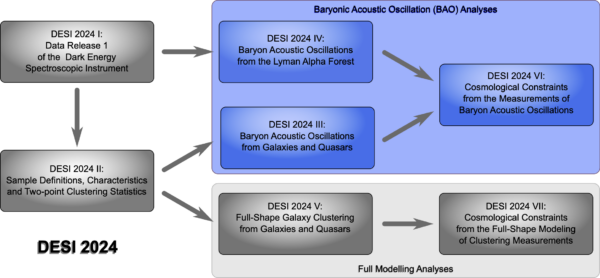
Over the past two weeks, we released another batch of supporting papers of fundamental importance for the ongoing DESI DR1 release. In particular, we present six new supporting papers within the category 

  • DESI 2024 II: Sample definitions, characteristics, and two-point clustering statistics.

These papers are:

  • Paper 1: Construction of Large-scale Structure Catalogs for Data from the Dark Energy Spectroscopic Instrument, corresponding author: Ashley Ross
  • Paper 2: Forward modeling fluctuations in the DESI LRG target sample using image simulations, corresponding author: Hui Kong
  • Paper 3: Impact and mitigation of spectroscopic systematics on DESI 2024 clustering measurements, corresponding author: Alex Krolewski
  • Paper 4: ELG Spectroscopic Systematics Analysis of the DESI Data Release 1, corresponding author: Jiaxi Yu
  • Paper 5: Mitigation of DESI fiber assignment incompleteness effect on two-point clustering with small angular scale truncated estimators, corresponding author: Mathilde Pinon
  • Paper 6: Blinding scheme for the scale-dependence bias signature of local primordial non-Gaussianity for DESI 2024, corresponding author: Edmond Chaussidon

But also the following previous papers belong to this category:

  • Paper 7: Production of Alternate Realizations of DESI Fiber Assignment for Unbiased Clustering Measurement in Data and Simulations, corresponding author: James Lasker
  • Paper 8: Validating the Galaxy and Quasar Catalog-Level Blinding Scheme for the DESI 2024 analysis, corresponding author: Uendert Andrade

Finally, we also report the release of a supporting paper for the category DESI 2024 III: BAO measurements with galaxies and quasars:

  • Paper 9: Fiducial Cosmology systematics for DESI 2024 BAO Analysis, corresponding author: Alejandro Pérez Fernández

For an overview of all the main categories in which the DESI 2024 publications are organised, see our April 4 Paper Guide. Paper 8 is already introduced in our April 11 Guide, and Papers 1-7 are described below, after some general remarks. 

The DESI 2024 II category encompasses all the steps starting from the observed galaxy and quasar redshifts and angular positions, correcting systematics related to target selection,  observing conditions and the geometry of the instrument (to name a few), towards defining the final “large-scale structure” (LSS) catalog, resembling the “true” (unbiased) observed three-dimensional density fluctuations of cosmological origin. Hence, from this final LSS or “clustering” catalog unbiased estimates of the two-point statistics can be obtained. These are subsequently used for the galaxy and quasar BAO (DESI 2024 III) and Full Shape (DESI 2024 V) analyses.

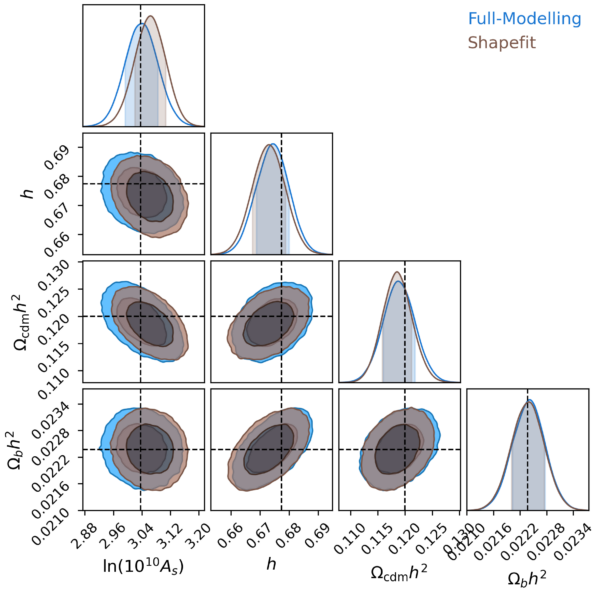
 As such, the systematic correction procedures motivated and validated in this set of publications represent a major stepping stone for us being able to interpret our 3D map in terms of cosmology. This is especially true for the Full Shape analysis yet to come, which is more sensitive to choices made in systematic corrections, whereas the BAO analysis would not be affected even if no systematic correction is applied.

Before delving into the technical details of the papers, let’s try to understand the systematics to correct for when converting DESI’s observations of the Bright Galaxy Survey (BGS), Luminous Red Galaxy (LRG), Emission Line Galaxy (ELG), and quasar (QSO) Samples into pure LSS clustering catalogs. Broadly, these systematics can be split into imaging, spectroscopic, and incompleteness systematics. 

Imaging Systematics

Before DESI started operations, we had to decide which targets to observe spectra from. These targets were selected from the imaging surveys (DES, DECaLS, MzLS and BASS) that provided images of billions of galaxies across the sky. For a general overview of the target selection process, see this blog article by Edmond Chaussidon and this overview of the target selection papers by Anand Raichoor and Christophe Yeche.

However, once the targets are selected, we have to make sure we understand how the observing conditions of each imaging survey and their differences in instruments and sky regions affects the density of target objects we are taking spectra from. As the light from distant galaxies travels through space, particularly through our own Milky Way galaxy and then Earth’s atmosphere, it gets messed up by various factors. For example, it might get slightly redirected or blocked by cosmic dust or changes because of air turbulence. We refer to these issues as “imaging systematics.” These are basically anything that can distort the galaxy images from what they truly look like.

To figure out how much these factors are affecting our galaxy images, we use something called survey property maps. These maps record the amount of cosmic dust, the number of stars in the field of view, and even issues introduced by the cameras and instruments themselves like noise and blurriness (‘seeing’). By understanding the correlations or “trends” between these maps and the galaxy images, we try to correct for these distortions and get a clearer, more accurate view of the galaxies in their surveys. 

For our LRG and ELG Samples we use the “Obiwan” software to inject galaxies to real images to reproduce the imaging systematics trends seen in real images. For LRG, this validation is shown in Paper 2. By comparing systematics trends between DESI LRGs and Obiwan LRGs, we find good agreement in depth. The trend with depth also depends on the intrinsic brightness of LRGs, and this dependency is also reproduced in Obiwan LRGs. Additionally, this study finds that the LRG systematics trend in the dust extinction map is mainly contributed by the large-scale structure systematics in the extinction map. This trend should not be completely corrected because it contains leaks from  large-scale-structure signals.

Spectroscopic systematics

While the previous systematics are related to the imaging surveys, as a next step we need to consider the systematics arising due to the observing conditions during the actual DESI operations measuring galaxy and quasar spectra. To each observed target spectrum, we fit a template spectrum to measure the corresponding redshift using the “Redrock” software (add link). However, only if the fit passes a certain signal-to-noise and goodness of fit threshold, the redshift measurement is considered “successful”, otherwise it is considered as “failed”. The ratio of successful redshift measurements with respect to all attempts is called “redshift success rate”. The success rates are very high (~99%) for BGS and LRG, but significantly less for the more distant (and hence fainter) ELG (72.4%) and QSO (66.2%) Samples. For ELG, the “failed” attempts are mostly related to the [OII] spectral line being either too faint or out of the DESI wavelength range. For QSO, there may be a variety of reasons such as confusion of the quasar targets with stars or other types of galaxies.

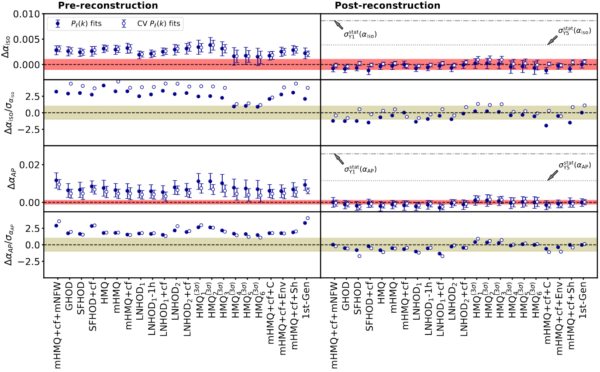
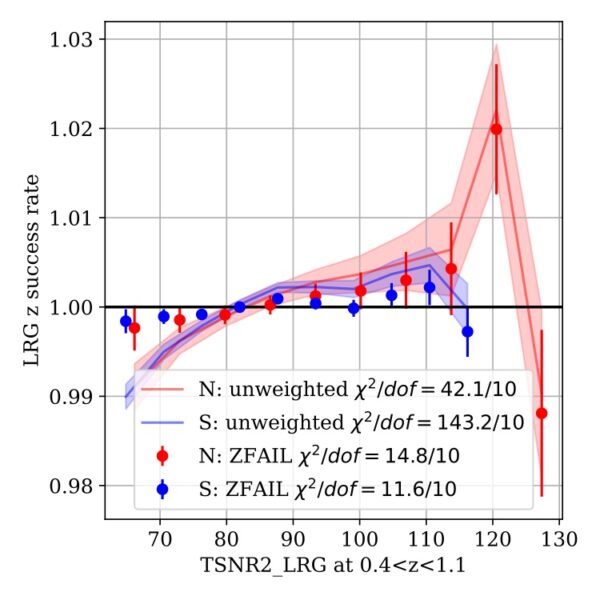
Of potential concern is the fact that the success rate specified above is not uniform and depends not only on the galaxy type but also on redshift, observing conditions, etc. We addressed this in Paper 3: 

As mentioned before, DESI uses galaxies as tracers of the underlying matter field, so we need to make sure that fluctuations in the observed galaxy density come from matter field fluctuations and not systematics. This paper assesses the impact of systematics coming from inhomogeneities in DESI observing conditions–for instance, some DESI tiles were observed longer than others (or some individual fibers are more sensitive than others) which potentially leads to fluctuations in galaxy density. We characterize the spectroscopic observing conditions with the “effective spectroscopic observing time,” which is exactly as it sounds: the length of time that the instrument would have to observe under ideal conditions to get the observed signal-to-noise of a DESI target. We show that these fluctuations are small, can be largely corrected by a simple weighting procedure, and have negligible impact on large-scale clustering. The plot shows how success rate depends on effective spectroscopic observing time, and how this trend is largely removed when the weights are applied.

This plot shows the LRG redshift success rate as a function of the template signal-to-noise ratio squared, which is a measure of the effective exposure time (i.e., the longer a galaxy is observed, the more prominent are its spectral lines) for the North (N) and South (S) Galactic Cap. Note that here the success rate is defined with respect to the overall success rate, so it can be greater than 1. Credits: Alex Krolewski.

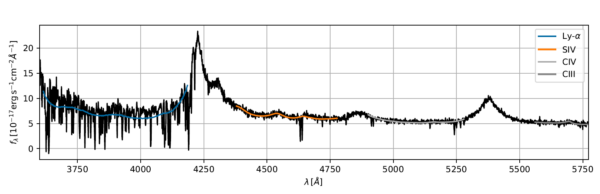
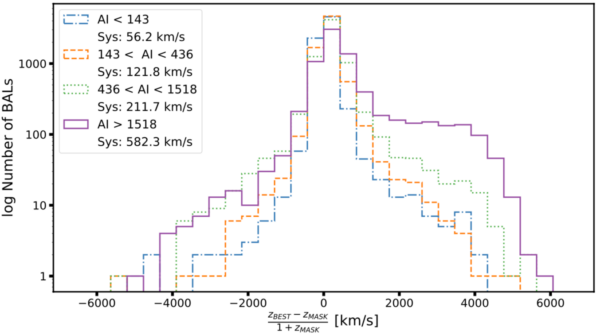
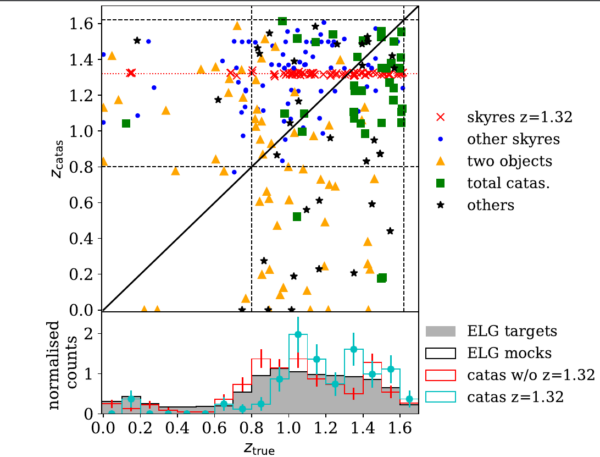
For the ELG Sample, there is an additional complication arising from the fact that sometimes the [OII] emission line can be confused with other lines, for example from the atmosphere, but at the same time may appear as a reasonably good fit (see figure below). We refer to these line confusions as “catastrophic” redshift failures. Paper 4 investigates this issue, finding that the “catastrophic redshift failure rate” of the DESI ELG Sample is 0.26%, which can be accounted for with an appropriate weighting scheme validated in that paper. To mitigate the sky confusion effect, one could also remove the contaminated redshift range 1.32<z<1.33.  In any case, the catastrophic redshift failures lead to negligible systematic biases in the full-shape analysis of  at most 0.2 times the statistical uncertainty.

Upper: The true redshift and the catastrophics redshift comparison of catastrophical failures on ELG redshift measurements. The captions represent the redshift misidentification of the sky residuals to be the [OII] emission that concentrates on z_catas ~ 1.32 (the horizontal dotted line), the same misidentification of sky residuals that result in z_catas at other redshifts, the redshifts identified in spectra that contain two objects, a total catastrophic failure due to no emission lines detection and all other types of catastrophics. Lower: the redshift distributions of ELG observations, mocks, catastrophics without the z=1.32 part and those with.

Incompleteness systematics 

All systematic effects having to do with the fact that DESI does not observe ALL existing galaxies but only a subset defined by the targets, the successful redshifts, and the geometry of the spectroscopic instrument may be described by this umbrella term. 

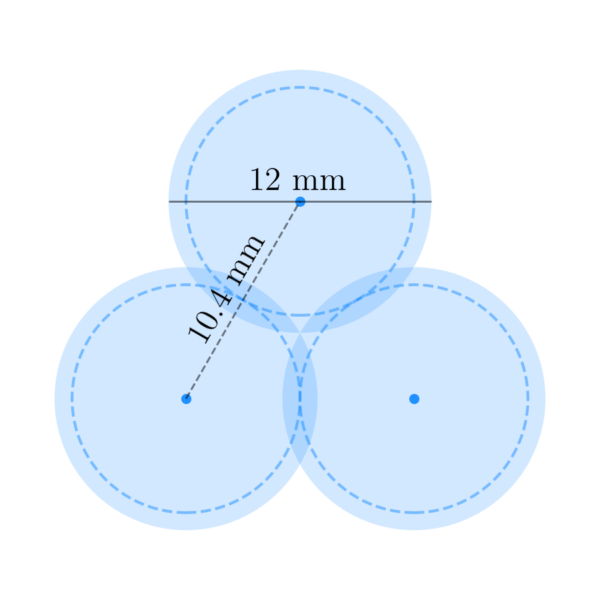
Let’s start with the instrument: In each exposure, spectra are obtained through 5000 fibers mounted at robotic positioners located within the focal plane. The fibers are automatically positioned towards the targets, but they can only be positioned within a certain patrol radius meaning, amongst other things, that two fibers can not be positioned infinitely close together, we refer to this fact as “fiber collision”. Hence, we are missing out on very close pairs of galaxies on the sky, which means that we are underestimating the “true” clustering of galaxies on small scales.

To capture this effect of “missing galaxies”, we rely on mock galaxy catalogs, obtained from large N-body Abacus simulations to represent a “full” galaxy sample. Next, we simulate how DESI would observe galaxies within this mock catalog given the instrument geometry to obtain a “mock observed” galaxy Sample. Comparing it to the “full” Sample, we can infer what is the effect of fiber collision and reproduce it on the real data using a probabilistic weighting scheme. This is exactly what has been done in Paper 7.

While DESI is observing an unprecedented number of galaxies, it is nowhere close to observing every galaxy in its list of possible targets, let alone every galaxy in the universe. In order to test physical models of galaxy formation, DESI must have a way to correct measurements of the clustering of the galaxies it is able to observe to represent the clustering of all target galaxies. In this paper, we show a method of generating probabilistic weights based on pairs of observed galaxies over random realizations of the DESI survey targeting. The most important result of this paper is shown in the plot linked above which shows the clustering from a mock galaxy catalog of Emission Line Galaxies (ELGs). The black line shows the clustering of all galaxies in the parent mock catalog, the blue line shows the clustering of an observed subsample corrected using the probabilistic pairwise weights detailed in the paper combined with upweighting based on angular clustering on the sky rather than in full 3D space. The green and orange lines show observed clustering weighted by only the angular upweights and only singular galaxy weighting respectively. In the inset, you can see the difference in the clustering measured with the weights from the parent mock catalog and the corrected clustering and it is consistent down to scales of 0.02 Mpc/h. This shows that weights generated using this method are valid. Credits: James Lasker

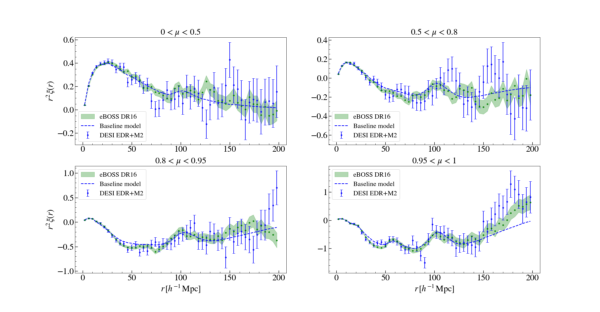
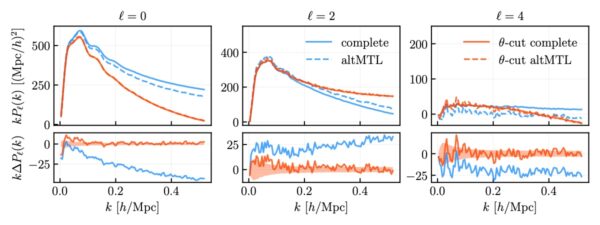
A more conservative approach relies on cutting out all the information arising from pairs of galaxies with angular separation smaller than θ ~ 0.05 degrees, corresponding to the angle covered by two neighboring fibers separated by 10.4 mm (see scheme below). We refer to this as the “θ-cut” method.

Patrol areas of three neighboring positioners (filled blue disks) in DESI focal plane. The patrol diameter corresponds to an angle of θ ~ 0.05 degrees on the sky (e.g. ∼2 Mpc/h at redshift 1). The fiber has a 107μm diameter core, and is protected by a sleeve with 0.4 mm diameter. Credits: Mathilde Pinon.

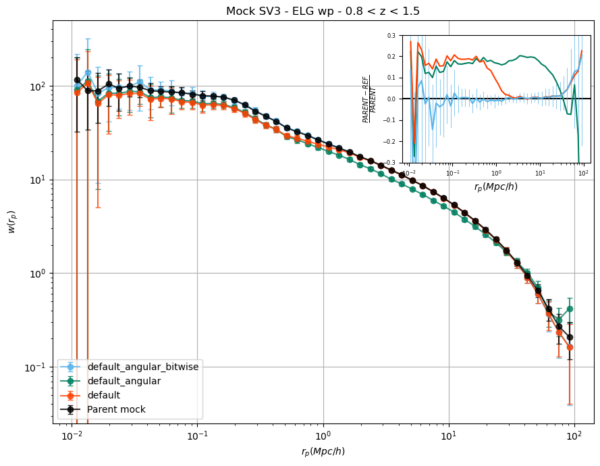
Paper 5 shows that by removing all the small pairs with angular separation θ < 0.05 degrees and imposing this condition in our models, we are able to completely remove the systematic uncertainty associated to fiber collisions, as demonstrated in the figure below.

Clustering statistics (power spectrum multipoles) obtained from galaxy mocks with either “complete” (solid) or “incomplete” (dashed) number of galaxies, the latter obtained by simulating the DESI fiber assignment with altMTL. When imposing the θ-cut condition (red), both cases are indistinguishable, while without the cut (blue) there is a residual difference in power spectra. Hence, the θ-cut method is an effective way to shield ourselves from a potential contamination of the cosmological signal due to fiber collisions. Credits: Mathilde Pinon.

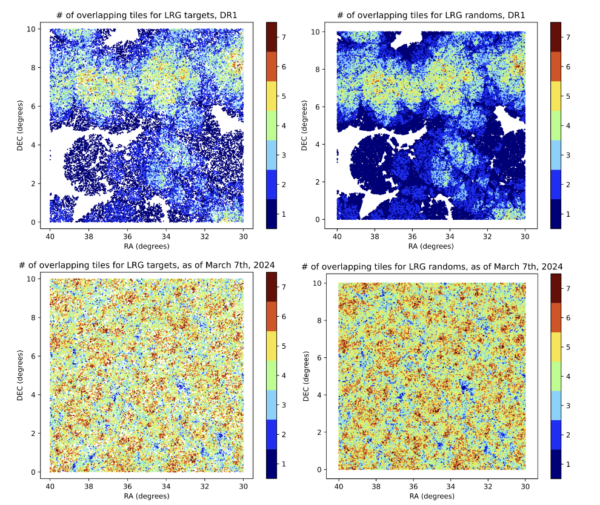
Finally, the results of all the weighting schemes presented until now come together in the LSS catalogue production pipeline presented in Paper 1. However, these different weights are not the end of the story, there are plenty of things to take into account. For instance, the fact that our observed galaxies are “incomplete”, means that in order to measure the actual clustering of galaxies, we cannot compare our map simply to a uniform distribution of galaxies. We need to compare to a random distribution of galaxies (without clustering) that matches exactly the sky area and mean density evolution with redshift of the DESI observations. This is tricky, given that some sky areas have yet been observed only once, while in other regions the observed tiles are overlapping to increase completeness. 

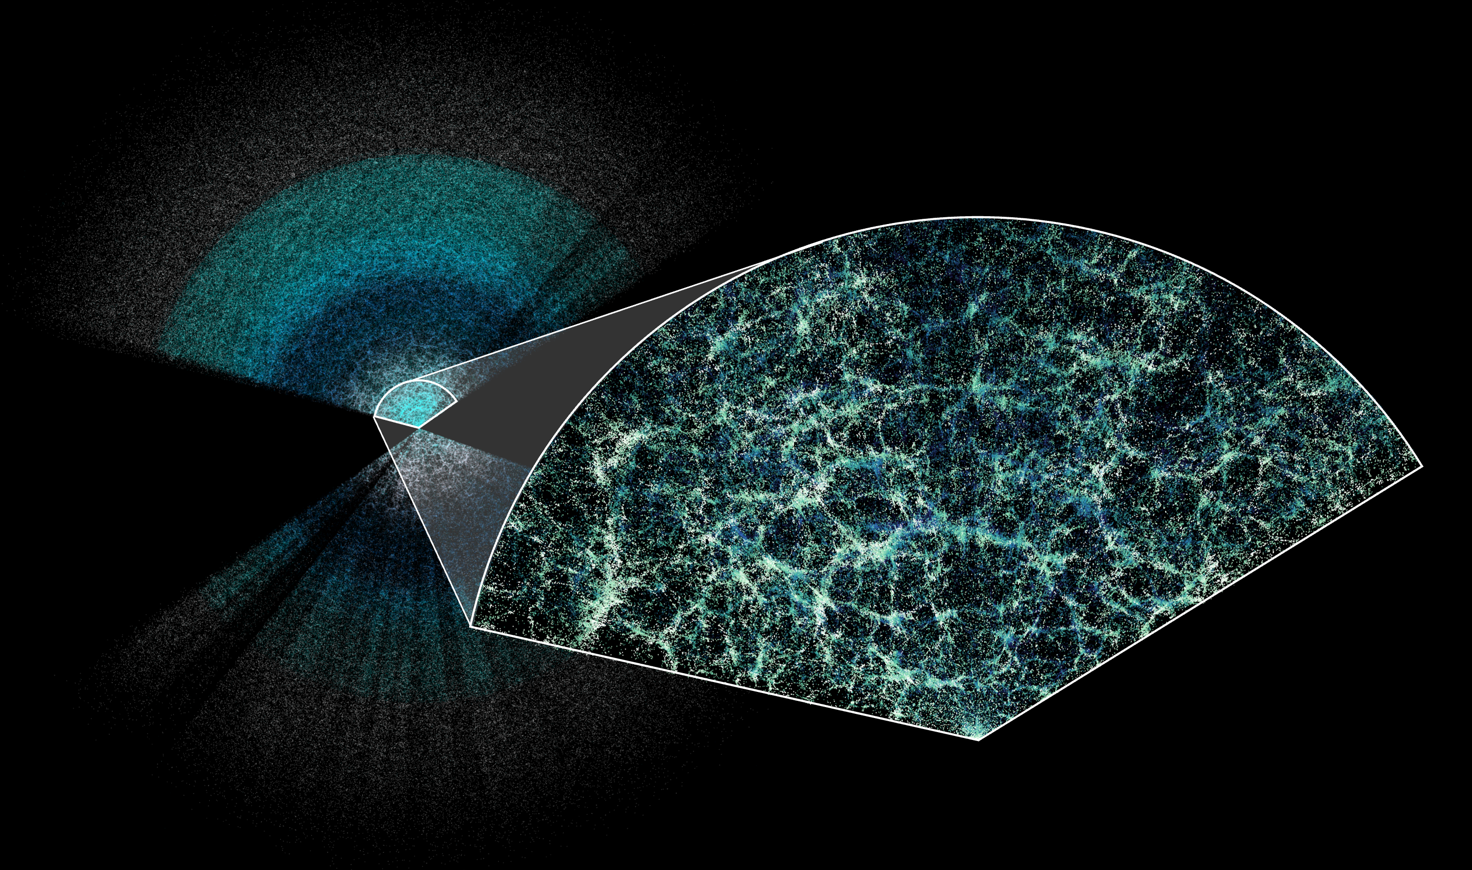
To visualize this problem see here a figure from Paper 1. The left column shows actual observed galaxies and the right column shows the galaxies we would have observed if galaxies were distributed randomly, i.e., if there was no BAO scale or gravitational clustering at all! Our actual clustering measurements are always defined as the excess clustering of the data with respect to that random Sample. Also, it displays how the tiling pattern evolved between the first year of operations (upper row) up to a few weeks before today, i.e. almost three years of operations. As you can see, the three-year sample is much more regular, so we are already looking forward to perform cosmological analyses on that more complete Sample!

Zoom into a certain sky region (see RA and DEC coordinates) showing the tile pattern after one year (top row) and almost three years of DESI operations. The color code indicates the number of overlapping tiles. The left column shows the actual data, while the right column displays the same tiling patter applied to a random distribution galaxies, serving as a proxy for the “mean” galaxy distribution. Our galaxy clustering measurements are always defined as the excess clustering of the data with respect to the randoms. Credits: Ashley Ross.

Modeling systematics

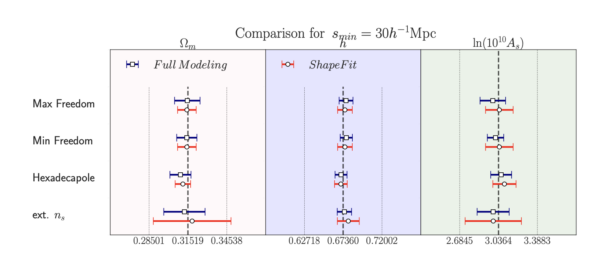
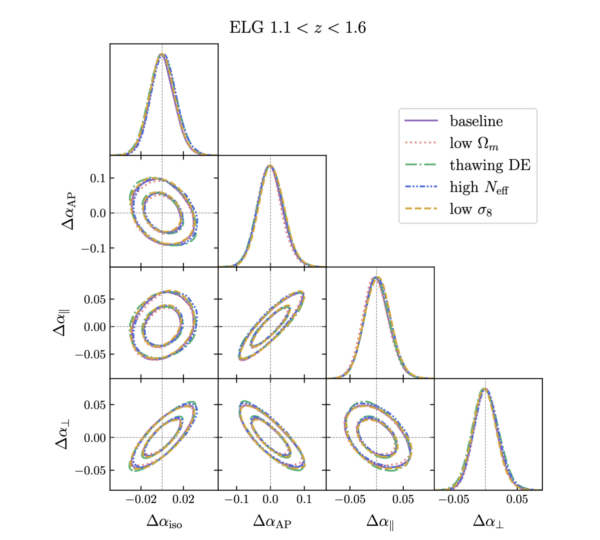
Decoupled from the systematics related to the instrument and observing condition, we also need to make sure that the theoretical systematic error budget arising from our cosmological models is under control. For the full-shape analysis, this has been studied in detail in the papers presented in our April 11 Guide, and for the BAO analysis from galaxies and quasars we tested the impact of the reconstruction scheme, the galaxy-halo connection and the BAO theory (for details, see our April 4 Guide.

Today, we release an additional paper (Paper 9) presenting an in-depth study of the impact of the so-called “fiducial cosmology assumption” BAO analyses are subject to. In a nutshell, to perform the BAO analysis with galaxies and quasars, all redshift measurements must be transformed to Cartesian coordinates under the assumption of a fiducial cosmological model, such that we can measure the full three-dimensional clustering statistics. At the same time, a template for the BAO peak at a given fiducial value of the sound horizon must be used to infer the excess probability of clustering in units of the sound horizon. In theory, that quantity is independent of the fiducial cosmology, however, it is essential to explicitly test whether this is indeed the case in practice. In Paper 9, the authors test the robustness of the BAO measurements against the choice of fiducial cosmology for both cases (coordinates and templates) individually and deliver an estimate of the associated contribution to the systematic error budget in the context of the DESI DR1 BAO analysis. They conclude a contribution of 0.1% in the dilation parameters.

Results for BAO scaling parameters for different fiducial cosmologies further quantified at the AbacusSummit website. The results agree spectacularly across the different fiducial cosmologies tested providing confidence to the robustness of our BAO results.

Blinding

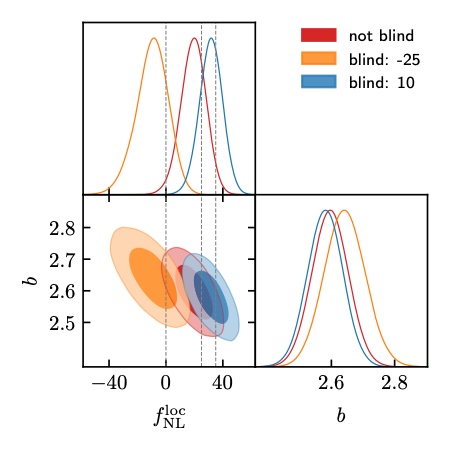
To shield ourselves from confirmation bias we decouple the analysis of systematic uncertainties presented before from the cosmological analysis by blinding the data at the catalog level until the cosmological analysis settings are determined. The Blinding scheme for BAO and RSD analyses has been presented in Paper 8 (see April 11 Guide). While that scheme works by displacing galaxies in their position along the line of sight, we implemented an independent catalog-level weighting scheme changing the galaxy density on large scales mimicking the presence of primordial non-Gaussianity (PNG).   

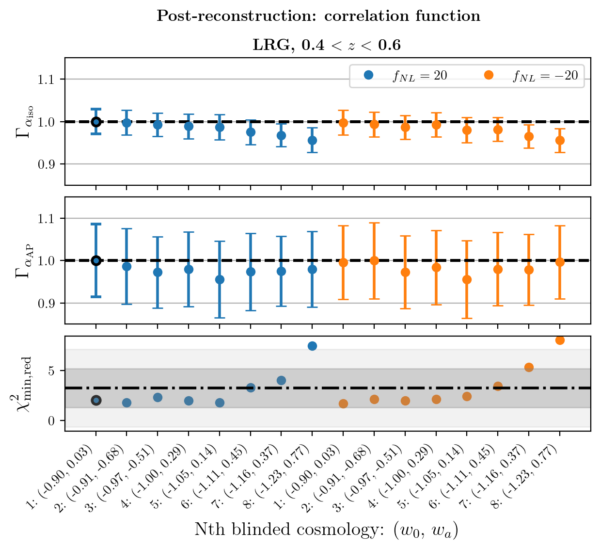
Paper 6 presents the blinding scheme applied in DESI DR1 to mask the large scale dependent bias signal in the power spectrum that is generated by the presence of PNG. This is particularly relevant since the large scale modes of the power spectrum are heavily contaminated by the dependence on the imaging properties of the target density. With this blinding, we can therefore perform a confirmation bias free analysis and be able to provide a robust measurement compare to Planck18. Although DR1 data will not have the statistical power to reach similar constraints than Planck, one can expect competitive constraints with the final data set of DESI.

Demonstration of the PNG Blinding scheme performance on mock data generated with a PNG strength (fNL local) of 25. When we blind the mock data with fNL=-25 and 10 and fit our model to the unblinded and the blinded data, we recover the expected fNL values, validating the blinding scheme for the real data analysis.

Conclusion

The set of papers published today mark an important milestone towards the cosmological analysis of our DESI 2024 DR1 Sample. The work that has been put into validating the LSS pipeline is invaluable for the full shape analysis yet to come and we are looking forward to unblinding our full-shape and RSD measurements very soon!

Filed Under: blog, feature on homepage

In this blogpost we introduce another batch of supporting papers released yesterday on April 11, just one week after releasing our cosmological results using BAO from galaxies and quasars and the Lyman-alpha forest. 

Yesterday’s papers do not exhibit new results, but represent major stepping stones towards the cosmology results from the RSD (aka Full Shape) analysis we plan to release soon. They fall into the two categories: 

  • DESI 2024 II: Sample definitions, characteristics, and two-point clustering statistics.
  • DESI 2024 V: Analysis of the full-shape of two-point clustering statistics from galaxies and quasars

DESI 2024 II: Sample definitions, characteristics, and two-point clustering statistics.

These papers describe the methods by which we ensure that all results properly take into account systematic effects, including: incomplete galaxy sampling, human biases, and imaging systematics. For a general overview of how DESI selects its targets, see this blog post, and for more information about survey validation see this blog post.

Most papers attributed to this category are yet to come out. But one of them, the paper presenting the DESI Blinding strategy, was already released yesterday, given its synergy with the BAO papers released a week ago, and with the Full Shape papers also released yesterday. It represents a major stepping stone validating the DESI 2024 Blinding strategy for the BAO and RSD (Full Shape) analysis.

Validating the Galaxy and Quasar catalog-level Blinding Scheme for the DESI 2024 analysis

Corresponding Author: Uendert Andrade

Arxiv: https://arxiv.org/abs/2404.07282 

Summary:

Short: This paper introduces the blinding strategy ensuring a data analysis without confirmation bias, validating it using mock catalogs and blinded data. 

Long: This paper introduces the galaxy and quasar BAO and RSD blinding scheme, where galaxy redshifts are displaced in two ways, such that overall they mimic i) a dark energy expansion history different than in the fiducial model with cosmological constant and 2) a different growth of structure history corresponding to a different law of gravity. Additionally, galaxy weights are applied to mimic the effect of primordial non-Gaussianity. BAO fits and full-shape fits (ShapeFit) are applied to one realization of Abacus mocks that was blinded according to 16 different varying dark energy and primordial non-Gaussianity scenarios. Additionally, the blinding scheme was applied to the blinded data and validated on that “double-blinded” catalog using BAO fits. 

This figure shows for one particular case the fitted isotropic and anisotropic BAO dilation parameters scaled to the expectation obtained from 8 different blindingalues of (w0, wa) and either positive (fnl=20) or negative (fnl=-20) primordial non-Gaussianity. Deviations from 1 are observed only for very extreme pairs of blinding values.

DESI 2024 V: Analysis of the full-shape of two-point clustering statistics from galaxies and quasars

This set of papers document various clustering statistics, modeling, and systematic analysis of DESI’s Year one galaxy and quasar samples. While there is yet more to come out, yesterday’s set of papers focus on the comparison between different Perturbation Theory models (based on Effective Field Theory (EFT)) and codes to the AbacusSummit LRG, ELG and QSO mocks. Overall, they find very good agreement among the different pipelines, corresponding to the Lagrangian and Eulerian Perturbation Theory (LPT and EPT) implementations within Velocileptors, as well as the EFT implementations of PyBird and FOLPSv, where the latter also features an improved model of the impact of massive neutrinos on structure formation.

Furthermore, the papers find excellent agreement between two very different approaches that are used nowadays to infer cosmological information from the full-shape of 2-point clustering statistics: 

  1. Template fits: Here, templates of the two-point statistics at a fixed fiducial cosmology are used to extract physical information from the data, the so-called ‘compressed parameters’ such as the isotropic and anisotropic dilation scales, the growth rate, and the scale-dependence, or shape. The latter is a rather new observable proposed in the ‘ShapeFit’ method, which represents the state-of-the-art method when it comes to template fits. Cosmological parameters are obtained by fitting cosmological models to these compressed parameters measured in each redshift bin. This is very similar to the philosophy behind the BAO analysis, where the (compressed) BAO scaling parameters are measured first in each redshift bin and cosmological parameters are obtained in a second step. 
  2. Full modeling fits: Here, the step of measuring compressed parameters is avoided. Instead, the 2-point statistics of all redshift bins are directly fitted according to the cosmological model. This is similar to the philosophy behind the analysis of cosmic microwave background (CMB) or weak lensing, where the 2-point statistics are also fitted directly, without an additional compression step in between.

Both these approaches have advantages and disadvantages. Template fits are designed to extract only the most robust information and allows for a modular interpretation. For example, they allow us to decouple the information on expansion history, growth history, and shape in an effective way. On the other hand, the extra compression step within the template fit method can erase some of the cosmological information within 2-point statistics. Direct fits allow us to squeeze all of the cosmological information out of the data. At the same time, their results are, by nature, model-dependent, and they do not provide the same means of performing diagnostic tests such as template fits.

For the DESI 2024 Full Shape analysis, we therefore plan to explore both approaches, and yesterday’s papers lay out the pathway of how to carry out both types of analysis in a robust way.

A comparison of effective field theory models of redshift space galaxy power spectra for DESI 2024 and future surveys

Corresponding Authors: Mark Maus, Yan Lai, Hernan E. Noriega and Sadi Ramirez-Solano

arXiv: https://arxiv.org/abs/2404.07272 

Summary:

Short: This paper models the redshift-space galaxy power spectrum into the quasi-linear regime with several different EFT models, compares the different models to each other, and tests each using the AbacusSummit simulations.

Long: This paper demonstrates the level of consistency between the different effective field theory models used for fitting galaxy power spectra in redshift space. We show, by fitting to Abacus cubic mocks, that velocileptors (Lagrangian and Eulerian PT versions), PyBird, and FOLPSv give consistent constraints in LCDM and ShapeFit parameters with differences in means of <0.1sigma. We also fit to noiseless theoretical data vectors created by each model while varying scale cuts, and show that for kmax=0.18 h/Mpc the systematic errors are far below the statistical errors for all parameters at precisions corresponding to 8 (Gpc/h)3 volumes.

An analysis of parameter compression and full-modeling techniques with Velocileptors for DESI 2024 and beyond

Corresponding author: Mark Maus 

arXiv: https://arxiv.org/abs/2404.07312 

Summary:

Short: This paper includes validation testing of various features of the analysis using the Velocileptors pipeline in combination with AbacusSummit mocks. Studies the dependence of the results on parameter compression, scale cuts, joint fitting, beyond-Lambda CDM modeling, inclusion of external data, and more.

Long: We present systematics tests and comparisons of three different modeling methods (Full-modeling, ShapeFit, and standard template) within velocileptors for modeling the galaxy power spectrum in redshift space using a Lagrangian effective field theory framework. We fit Abacus N-body simulations created to mimic the LRG, ELG, and QSO tracers that DESI targets, and show that ShapeFit and Full-modeling have consistent constraints and similar constraining power on LCDM models. We demonstrate the behavior of the three modeling methods for a variety of fitting settings with/without including BAO information in order to describe optimal fitting settings for velocileptors for DESI Y1 analyses and beyond.

We demonstrate constraints on the LRG mock data for the three modeling methods in the right panel of Fig. 3, also shown here:

Comparing Compressed and Full-modeling Analyses with FOLPS: Implications for DESI 2024 and beyond

Corresponding author: Hernan E. Noriega

arXiv: https://arxiv.org/abs/2404.07269 

Summary: 

Short: This paper explores potential sources of systematic error in the full-shape analysis and compression techniques, using the AbacusSummit mocks.

Long: This work validates the robustness of the theoretical modelling of FOLPS, which properly takes into account the presence of massive neutrinos. The study finds that potential modelling errors are fully sub-dominant for DESI’s statistical precision. The research also compares Full-Modeling and ShapeFit fitting approaches, demonstrating their agreement. Overall, this work paves the way for a robust analysis of the DESI power spectrum.

A comparison between Shapefit compression and Full-Modelling method with PyBird for DESI 2024 and beyond

Corresponding author: Yan Lai

arXiv: https://arxiv.org/abs/2404.07283 

Summary: 

Short: This paper shows that the Shapefit compression matches cosmological constraints using traditional full-shape analysis for ΛCDM, wCDM, and oCDM models.

Long: In this paper, we compare the constraints of cosmological parameters from Shapefit and Full-Modelling with PyBird. We do this with the DESI cubic box mocks for Luminous Red galaxies (LRG), Emission Line Galaxies (ELG), and Quasi Steller Object (QSO) for the LCDM, wCDM, and oCDM models. We found for all three cosmological models tested, the constraints from Shapefit and Full-Shape are consistent with each other. Furthermore, the constraints from both methodologies agree with the underlying cosmology.

Full Modeling and Parameter Compression Methods in configuration space for DESI 2024 and beyond

Corresponding author: Sadi Ramirez-Solano

arXiv: https://arxiv.org/abs/2404.07268
Summary: 

Short: This paper includes similar studies as the other projects in this group, but for configuration space

Long: This work conducts a thorough comparison of various methodologies for modeling the full shape of the two-point statistics in configuration space. We investigate the performance of both direct fits (Full-Modeling) and the parameter compression approaches (ShapeFit and Standard) with CLPT-EFT. Our pipeline recovers unbiased cosmological parameter values for a 1-year DESI volume. We also present the comparisons of the configuration space version of different EFT models.


Filed Under: blog, feature on homepage

Scientific American, 12 April 2024

Filed Under: in the news

Physics, 9 April 2024

Filed Under: in the news Tagged With: DESI 2024 BAO

Cosmology Talks on Youtube, 4 April 2024

Filed Under: in the news Tagged With: DESI 2024 BAO

Science News, 4 April 2024

Filed Under: in the news Tagged With: DESI 2024 BAO

Quanta Magazine, 4 April 2024

Filed Under: in the news Tagged With: DESI 2024 BAO

New York Times, 4 April 2024

Filed Under: in the news Tagged With: DESI 2024 BAO

Lawrence Berkeley National Laboratory, 4 April 2024

Filed Under: press releases

On April 4, DESI released a set of papers marking our first release of year one (Y1) results. This page contains summaries of our main results and a guide to the publications. The papers will be available on arXiv at 5pm PST on April 4, and until then are available here.

Helpful links

  • A press release containing a high-level overview of our main results: https://newscenter.lbl.gov/2024/04/04/desi-first-results-make-most-precise-measurement-of-expanding-universe/ 
  • A brief announcement on our webpage: https://www.desi.lbl.gov/2024/04/04/first-cosmology-results-from-desi-most-precise-measurement-of-the-expanding-universe/ 
  • A list of current papers: https://data.desi.lbl.gov/doc/papers/ 
  • For more background on DESI’s science, see our public webpages.
  • DESI’s Y1 data is not yet public, but you can find our early data release and any updates on this site: https://data.desi.lbl.gov/doc/releases/
The key figure used in the press release is from a narrow band on the sky, spanning 190 degrees in right ascension and 14 degrees in declination. The magnified section consists of galaxies from our Bright Galaxy Sample and extends to a redshift of 0.2. This represents less than 0.1% of our full survey volume. Image credit: Claire Lamman/DESI collaboration; custom colormap package by cmastro.

The Y1 results fall into seven main categories, three of these (highlighted in blue) are released on April 4:, BAO measurements with galaxies and quasars (DESI 2024 III), BAO with the Lyman-alpha forest  (DESI 2024 IV), and cosmological inference from BAOs (DESI 2024 VI). This figure displays the publication organization with the results released on April 4 highlighted in blue, and summaries of each can be found below.

The seven categories in which the DESI 2024 papers are organised. Each topic consists of one key collaboration paper and several supporting papers. The papers of three of these categories (highlighted in blue) are released on April 4. The corresponding supporting papers are listed below (DESI 2024 VI consists of one key paper only).
Image credit: Gustavo Niz


April 4 Paper Summaries

BAO Measurements from Galaxies and Quasars

Baryon Acoustic Oscillations (BAO) are a powerful tool to measure cosmic expansion through the “standard rulers” created by expanding overdensities from the early universe. Using galaxies as tracers of these overdensities, this set of papers describe DESI’s galaxy BAO measurements. This is the largest dataset ever used to measure BAO, by both number of galaxies and volume. They are the most precise measurements of their kind, at 0.52%.

DESI 2024 III: Baryon Acoustic Oscillations from Galaxies and Quasars

Arxiv: 2404.03000

Summary: This is an overview of the main DESI Year-1 BAO results from galaxies and quasars.

Baryon Acoustic Oscillation Theory and Modelling Systematics for the DESI 2024 results (submitted in Feb 2024)

Corresponding author: Shi-Fan Chen

Arxiv:  2402.14070 

Summary: Baryon acoustic oscillations are one of the best standard rulers there are. In this paper the authors work out just how robust they are, and how to best fit and extract the signal from DESI data.

The “BAO Hubble Diagram” made with different galaxy tracers, compared to previous measurements from eBOSS. Each subplot shows how the BAO scale evolves with redshift. The y-axis are, from top to bottom: The transverse BAO size, the line-of-sight BAO size, the overall BAO size, and the anisotropy of BAO.


Optimal reconstruction of baryon acoustic oscillations for DESI 2024

Corresponding authors: Enrique Paillas, Zhejie Ding, Xinyi Chen

Arxiv: 2404.03005

Summary: This paper investigates different reconstruction settings to optimize BAO detection. Reconstruction is a sophisticated technique enabling a more precise (lower statistical error) and more accurate (lower systematic error) BAO measurement. When considering the galaxy distribution, unfortunately the pristine BAO signal is slightly erased and contaminated by the galaxies’ velocity originating from their mutual gravitational interaction. Luckily, from the observed galaxy density we can calculate the gravitational potential at each galaxy and hence estimate their velocities. Using that estimate, we can displace each galaxy to its initial position and hence “reconstruct” the initial galaxy field exhibiting the original, pristine BAO signal. This work shows on Abacus mock catalogs that after applying reconstruction (post-recon) the BAO peak in the two-point correlation function is enhanced (see figure) and slightly shifted (not visible by eye in this figure) towards the location predicted by the cosmological model. 

For non-cosmologists: the two-point correlation function is basically a histogram of the number of galaxy pairs that are separated by a distance “s”. It hence describes the excess probability of finding two galaxies separated by “s”.

Two point correlation function of the average of 25 Abacus galaxy mock catalogs (data points) compared to the model prediction (lines) pre- (grey) and post-reconstruction (yellow)

Semi-analytical covariance matrices for two-point correlation function for DESI 2024 data

Corresponding author: Michael Rashkovetskyi

Arxiv: 2404.03007

Summary: This work improves and validates an efficient method for generating covariance matrices for clustering analyses using the correlation functions. In particular, the authors report a close agreement in projected errorbars for BAO scale parameters between the mock-based (more standard) and semi-analytical (faster) covariance matrices, as shown in the right figure.

HOD-Dependent Systematics for Luminous Red Galaxies in the DESI 2024 BAO Analysis

Corresponding author: Juan Mena-Fernández

Arxiv: 2404.03008

Summary: This paper investigates how the halo occupation distribution (HOD) modeling might affect the measurement of the BAO distance scale in the DESI Y1 analysis. This is done for LRGs, using several sets of Abacus simulations (that rely on dark matter only) with different HOD models (that populate dark matter halos with galaxies) in order to estimate the amplitude of the so-called HOD systematics. This work finds that the BAO measurements are robust enough against these kinds of systematics for the DESI 2024 analysis, and provides the estimated error budget.

Relative overall BAO size (left) and relative anisotropy of the BAO (right), measured either with a Fourier (dots) or real-space (triangles) analysis, as a function of the HOD prescription (labeled A0, …, B3). Such a prescription is necessary to convert the pure cold dark matter halo output of the underlying Abacus simulations into a field of galaxies, which is what DESI observes. Lower panels (red data points) and top panels (green data points) show BAO results obtained with and without the reconstruction method described before. This figure clearly shows i) the scatter with HOD model is less than the theoretical error (gray band) and ii) the necessity of reconstruction to obtain accurate BAO measurements.

HOD-Dependent Systematics for Emission Line Galaxies in the DESI 2024 BAO analysis 

Corresponding author: Cristhian Garcia-Qunitero

Arxiv: 2404.03009

Summary: This paper consists of a series of tests to assess the robustness of the BAO analysis against HOD-dependence in the ELG tracer, and compare the differences found with the forecasted error with one year of DESI data.

We found that our BAO fits are robust enough against this systematics for DESI 2024 results and provide the error budget for this particular systematics.

Similar to the previous figure, but for the ELG sample. The relative overall (top) and anisotropic (bottom) BAO size are shown for a variety of HOD models and again, the necessity of the reconstruction scheme (right panels) to yield accurate results is evident. Grey arrows and dashdotted (dotted) lines indicate the statistical uncertainty of DESI Y1 (Y5) early forecasts, clearly showing the systematic uncertainty due to the HOD modeling is subdominant.


BAO with the Lyman-alpha forest

The Lyman-alpha forest refers to absorption lines in the light of distant quasars, which reveal the distribution of gas along the line of sight. This allows DESI to extend our BAO analysis beyond the galaxy tracers and measure the most ancient BAO signatures, up to when the Universe was just ⅕ its current age. DESI’s Y1 results provide measurements of the isotropic BAO scale at 1.1% precision, the most precise measurement in the redshift ranges of 2 < z < 4.

This plot shows the line-of-sight and transverse scale of BAO as measured by the Lyman-alpha forest with DESI. It includes measurements made with correlating the Lyman-alpha forest with itself and with the distribution of quasars. The result is a 1.1% precision measurement on the BAO scale at an effective redshift of 2.33.


DESI 2024 IV: Baryon Acoustic Oscillations from the Lyman Alpha Forest

Arxiv: 2404.03001

Summary: This is the main paper for BAO with the Lyman Alpha Forest, presenting the Lyman Alpha forest BAO measurement from over 420,000 spectra and their correlation with >700,000 quasars at an effective redshift of z=2.33.


The Lyman-α forest catalog from the Dark Energy Spectroscopic Instrument Early Data Release (published in December 2023)

Corresponding author: César Ramírez-Pérez

Article: https://academic.oup.com/mnras/article/528/4/6666/7462317?login=false 

Summary: This publication presents and validates the Lyman-alpha forest fluctuations in the first DESI data release. To accomplish this measurement, the continua of DESI quasars were fitted not only in the Lyman-alpha forest region but also in featureless regions to the right of the Lyman-alpha emission line, which were used for calibration.

The image displays the observed flux (black) of a high-SNR DESI quasar. The different coloured lines show the expected flux for each of the regions (quasar continuum corrected by the mean absorption), for the Lyman-alpha forest region and the SIV, CIV and CIII calibration regions.


3D Correlations in the Lyman-α Forest from Early DESI Data (published in November 2023)

Corresponding author: Calum Gordon

Article: https://iopscience.iop.org/article/10.1088/1475-7516/2023/11/045

Summary: This is the first analysis of 3D Lyman-a correlations in early DESI data. The BAO peak is strongly detected, and the results are in good agreement with previous analyses of Lyman-a forest correlations from eBOSS. The figure here shows the measured auto-correlation in bins of mu = r_parallel / r, including eBOSS and DESI early data, and the best-fitting model.

Synthetic spectra for Lyman-α forest analysis in the Dark Energy Spectroscopic Instrument (submitted in January 2024)

Corresponding author: Hiram K. Herrera-Alcantar

Arxiv: 2401.00303

Summary: This paper presents the methodology followed to produce synthetic DESI Lyman-𝛼 datasets. We include all the steps from the raw transmitted flux generation to the addition of a continuum and instrumental noise to spectra. We perform a qualitative comparison of the results of DESI EDR+M2 simulated and observed data. And present a Forecast of the full DESI survey constraining power (show in figure).


Impact of Systematic Redshift Errors on the Cross-correlation of the Lyman-α Forest with Quasars at Small Scales Using DESI Early Data (submitted in February 2024)

Corresponding author: Abby Bault

arxiv: 2402.18009

Summary: 

This publication presents a measurement of the systematic redshift errors from the DESI EDR+M2 quasar sample. We find evidence for a redshift-dependent bias causing redshifts to be underestimated with increasing redshift. This bias stems from the templates used for redshift estimation in the EDR+M2 sample. After deriving new templates for the DESI Year 1 quasar sample we repeat our analysis and no longer find evidence of a bias.

The image shows the measured redshift errors for the EDR+M2 and Year 1 samples when the catalog is cut into four redshift bins. For the EDR+M2 data (light blue triangles) there is a clear trend where the measured errors increase with increasing redshift. For the Year 1 data (dark blue circles) this bias is no longer present. The measured error for the full Year 1 catalog, shown in the light red region, also shows that the bias has been mitigated.


Characterization of contaminants in the Lyman-alpha forest auto-correlation with DESI

Corresponding authors: Julien Guy, Satya Gontcho A Gontcho

Arxiv: 2404.03003

Summary: This paper studies the signal introduced by the instrumental processing of the data that contaminates the signal detected from the Lyman Alpha Forest (neutral hydrogen clouds). In addition, it also studies the signal introduced by clouds of other chemical species (not neutral hydrogen) that contaminates the Lyman Alpha Forest signal. The conclusion of this paper is a thorough characterization of the instrumental and astrophysical contaminants of the Lyman Alpha Forest signal.


Validation of the DESI 2024 Lyα forest BAO analysis using synthetic dataset

Corresponding author: Andrei Cuceu

Arxiv: 2404.03004

Summary: This paper documents the creation of mocks for the Lyman-alpha BAO validation, validation of the pipeline using those mocks.


Broad Absorption Line Quasars in the Dark Energy Spectroscopic Instrument Early Data Release (submitted in September 2023)

Corresponding authors: Simon Filbert, Paul Martini

arxiv: 2309.03434

Summary: Broad absorption line (BAL) quasars can have significant absorption troughs near or coincident with the locations of some of the most prominent emission lines in quasar spectra. This paper presents a study of the impact of these features on how accurately we can measure the recession velocity (or redshift) of BAL quasars and presents strategies to mitigate their impact. The figure shows the differences in the redshift before and after mitigating the impact of the BAL features for various types of BALs.

Cosmological Inference 

This final paper interprets the analysis documented above. DESI’s Year one BAO measurements constrain the density of matter in the universe, Ωm,  and the rate of expansion of the universe, H, relative to the sound horizon, r_d. These measurements reveal the growth rate of the universe over time, and, consequently, the impact of dark energy.

A Hubble diagram combining BAO measurements from all tracers. The results slightly favor a model of dark energy which evolves with time. For an annotated version of this plot, see the press release linked above.
Image Credit: Arnaud de Mattia/DESI collaboration


DESI 2024 VI: Cosmological Constraints from the Measurements of Baryon Acoustic Oscillations

Arxiv: 2404.03002

Summary: This paper analyzes the BAO measurements from all tracers, which are complementary to each other. The results are consistent with SDSS and CMB measurements. DESI’s measurements are compatible with the standard cosmological model, LCDM, but slightly prefer a model of dark energy which evolves with time.

Filed Under: blog, feature on homepage

Sky & Telescope, 2 February 2024

Filed Under: in the news

Scientific American, 1 December 2023

Filed Under: in the news

Primary Sidebar

Copyright © 2018 Dark Energy Spectroscopic Instrument [DESI]

  • / science /
    • science overview
    • cosmology and dark energy
    • redshifts and distance
    • mapping the universe
    • the DESI science mission
    • the DESI survey
    • imaging surveys
  • / instrument /
    • instrument overview
    • telescope
      • tohono o’odham
    • corrector
    • focal plane system
    • fiber system
    • spectrograph
    • instrument control system
    • data systems
    • bringing DESI to life
      • commissioning Instrument
      • protoDESI
  • / collaboration /
    • DESI team
    • DESI builders
    • collaborating institutions
    • sponsors
    • code of conduct
    • vendors
    • collaboration policies
  • / press /
    • announcements
    • in the news
    • press releases
    • tweets by desisurvey
    • blog
    • acknowledgments
  • / galleries /
    • videos
    • image gallery
  • / for scientists /
    • data releases
    • instrument design
    • imaging data
    • target selection and survey validation
    • theory and simulations
    • other DESI science
    • key publications
    • all DESI papers
    • team login
    • request a DESI speaker
    • internal
  • / education & outreach /
    • meet a DESI member
    • blog
    • planetarium show
    • DESI high
    • interactive visualizations
    • DESI Merch

Footer

TEAM LOGIN

twitter   instagram   facebook

Copyright © 2018 Dark Energy Spectroscopic Instrument [DESI]

Copyright © 2025 · Parallax Pro DESI on Genesis Framework · WordPress · Log in