Over the past two weeks, we released another batch of supporting papers of fundamental importance for the ongoing DESI DR1 release. In particular, we present six new supporting papers within the category
- DESI 2024 II: Sample definitions, characteristics, and two-point clustering statistics.
These papers are:
- Paper 1: Construction of Large-scale Structure Catalogs for Data from the Dark Energy Spectroscopic Instrument, corresponding author: Ashley Ross
- Paper 2: Forward modeling fluctuations in the DESI LRG target sample using image simulations, corresponding author: Hui Kong
- Paper 3: Impact and mitigation of spectroscopic systematics on DESI 2024 clustering measurements, corresponding author: Alex Krolewski
- Paper 4: ELG Spectroscopic Systematics Analysis of the DESI Data Release 1, corresponding author: Jiaxi Yu
- Paper 5: Mitigation of DESI fiber assignment incompleteness effect on two-point clustering with small angular scale truncated estimators, corresponding author: Mathilde Pinon
- Paper 6: Blinding scheme for the scale-dependence bias signature of local primordial non-Gaussianity for DESI 2024, corresponding author: Edmond Chaussidon
But also the following previous papers belong to this category:
- Paper 7: Production of Alternate Realizations of DESI Fiber Assignment for Unbiased Clustering Measurement in Data and Simulations, corresponding author: James Lasker
- Paper 8: Validating the Galaxy and Quasar Catalog-Level Blinding Scheme for the DESI 2024 analysis, corresponding author: Uendert Andrade
Finally, we also report the release of a supporting paper for the category DESI 2024 III: BAO measurements with galaxies and quasars:
- Paper 9: Fiducial Cosmology systematics for DESI 2024 BAO Analysis, corresponding author: Alejandro Pérez Fernández
For an overview of all the main categories in which the DESI 2024 publications are organised, see our April 4 Paper Guide. Paper 8 is already introduced in our April 11 Guide, and Papers 1-7 are described below, after some general remarks.
The DESI 2024 II category encompasses all the steps starting from the observed galaxy and quasar redshifts and angular positions, correcting systematics related to target selection, observing conditions and the geometry of the instrument (to name a few), towards defining the final “large-scale structure” (LSS) catalog, resembling the “true” (unbiased) observed three-dimensional density fluctuations of cosmological origin. Hence, from this final LSS or “clustering” catalog unbiased estimates of the two-point statistics can be obtained. These are subsequently used for the galaxy and quasar BAO (DESI 2024 III) and Full Shape (DESI 2024 V) analyses.
As such, the systematic correction procedures motivated and validated in this set of publications represent a major stepping stone for us being able to interpret our 3D map in terms of cosmology. This is especially true for the Full Shape analysis yet to come, which is more sensitive to choices made in systematic corrections, whereas the BAO analysis would not be affected even if no systematic correction is applied.
Before delving into the technical details of the papers, let’s try to understand the systematics to correct for when converting DESI’s observations of the Bright Galaxy Survey (BGS), Luminous Red Galaxy (LRG), Emission Line Galaxy (ELG), and quasar (QSO) Samples into pure LSS clustering catalogs. Broadly, these systematics can be split into imaging, spectroscopic, and incompleteness systematics.
Imaging Systematics
Before DESI started operations, we had to decide which targets to observe spectra from. These targets were selected from the imaging surveys (DES, DECaLS, MzLS and BASS) that provided images of billions of galaxies across the sky. For a general overview of the target selection process, see this blog article by Edmond Chaussidon and this overview of the target selection papers by Anand Raichoor and Christophe Yeche.
However, once the targets are selected, we have to make sure we understand how the observing conditions of each imaging survey and their differences in instruments and sky regions affects the density of target objects we are taking spectra from. As the light from distant galaxies travels through space, particularly through our own Milky Way galaxy and then Earth’s atmosphere, it gets messed up by various factors. For example, it might get slightly redirected or blocked by cosmic dust or changes because of air turbulence. We refer to these issues as “imaging systematics.” These are basically anything that can distort the galaxy images from what they truly look like.
To figure out how much these factors are affecting our galaxy images, we use something called survey property maps. These maps record the amount of cosmic dust, the number of stars in the field of view, and even issues introduced by the cameras and instruments themselves like noise and blurriness (‘seeing’). By understanding the correlations or “trends” between these maps and the galaxy images, we try to correct for these distortions and get a clearer, more accurate view of the galaxies in their surveys.
For our LRG and ELG Samples we use the “Obiwan” software to inject galaxies to real images to reproduce the imaging systematics trends seen in real images. For LRG, this validation is shown in Paper 2. By comparing systematics trends between DESI LRGs and Obiwan LRGs, we find good agreement in depth. The trend with depth also depends on the intrinsic brightness of LRGs, and this dependency is also reproduced in Obiwan LRGs. Additionally, this study finds that the LRG systematics trend in the dust extinction map is mainly contributed by the large-scale structure systematics in the extinction map. This trend should not be completely corrected because it contains leaks from large-scale-structure signals.
Spectroscopic systematics
While the previous systematics are related to the imaging surveys, as a next step we need to consider the systematics arising due to the observing conditions during the actual DESI operations measuring galaxy and quasar spectra. To each observed target spectrum, we fit a template spectrum to measure the corresponding redshift using the “Redrock” software (add link). However, only if the fit passes a certain signal-to-noise and goodness of fit threshold, the redshift measurement is considered “successful”, otherwise it is considered as “failed”. The ratio of successful redshift measurements with respect to all attempts is called “redshift success rate”. The success rates are very high (~99%) for BGS and LRG, but significantly less for the more distant (and hence fainter) ELG (72.4%) and QSO (66.2%) Samples. For ELG, the “failed” attempts are mostly related to the [OII] spectral line being either too faint or out of the DESI wavelength range. For QSO, there may be a variety of reasons such as confusion of the quasar targets with stars or other types of galaxies.
Of potential concern is the fact that the success rate specified above is not uniform and depends not only on the galaxy type but also on redshift, observing conditions, etc. We addressed this in Paper 3:
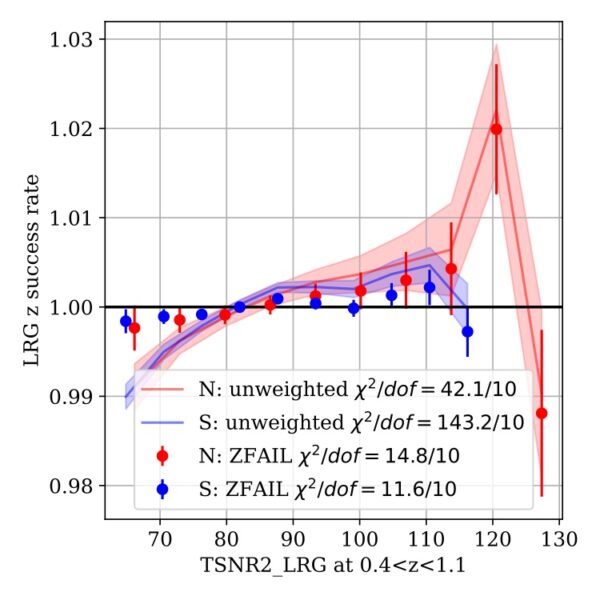
As mentioned before, DESI uses galaxies as tracers of the underlying matter field, so we need to make sure that fluctuations in the observed galaxy density come from matter field fluctuations and not systematics. This paper assesses the impact of systematics coming from inhomogeneities in DESI observing conditions–for instance, some DESI tiles were observed longer than others (or some individual fibers are more sensitive than others) which potentially leads to fluctuations in galaxy density. We characterize the spectroscopic observing conditions with the “effective spectroscopic observing time,” which is exactly as it sounds: the length of time that the instrument would have to observe under ideal conditions to get the observed signal-to-noise of a DESI target. We show that these fluctuations are small, can be largely corrected by a simple weighting procedure, and have negligible impact on large-scale clustering. The plot shows how success rate depends on effective spectroscopic observing time, and how this trend is largely removed when the weights are applied.
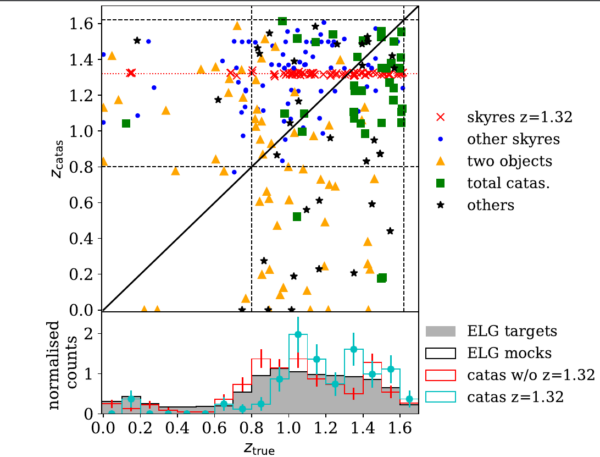
For the ELG Sample, there is an additional complication arising from the fact that sometimes the [OII] emission line can be confused with other lines, for example from the atmosphere, but at the same time may appear as a reasonably good fit (see figure below). We refer to these line confusions as “catastrophic” redshift failures. Paper 4 investigates this issue, finding that the “catastrophic redshift failure rate” of the DESI ELG Sample is 0.26%, which can be accounted for with an appropriate weighting scheme validated in that paper. To mitigate the sky confusion effect, one could also remove the contaminated redshift range 1.32<z<1.33. In any case, the catastrophic redshift failures lead to negligible systematic biases in the full-shape analysis of at most 0.2 times the statistical uncertainty.
Incompleteness systematics
All systematic effects having to do with the fact that DESI does not observe ALL existing galaxies but only a subset defined by the targets, the successful redshifts, and the geometry of the spectroscopic instrument may be described by this umbrella term.
Let’s start with the instrument: In each exposure, spectra are obtained through 5000 fibers mounted at robotic positioners located within the focal plane. The fibers are automatically positioned towards the targets, but they can only be positioned within a certain patrol radius meaning, amongst other things, that two fibers can not be positioned infinitely close together, we refer to this fact as “fiber collision”. Hence, we are missing out on very close pairs of galaxies on the sky, which means that we are underestimating the “true” clustering of galaxies on small scales.
To capture this effect of “missing galaxies”, we rely on mock galaxy catalogs, obtained from large N-body Abacus simulations to represent a “full” galaxy sample. Next, we simulate how DESI would observe galaxies within this mock catalog given the instrument geometry to obtain a “mock observed” galaxy Sample. Comparing it to the “full” Sample, we can infer what is the effect of fiber collision and reproduce it on the real data using a probabilistic weighting scheme. This is exactly what has been done in Paper 7.
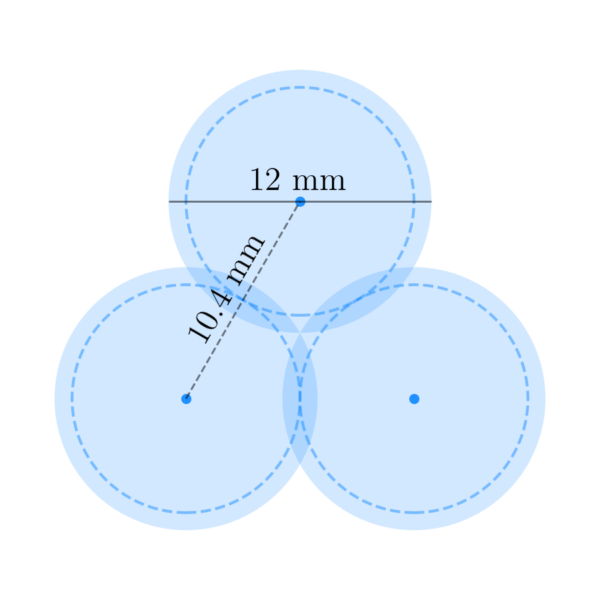
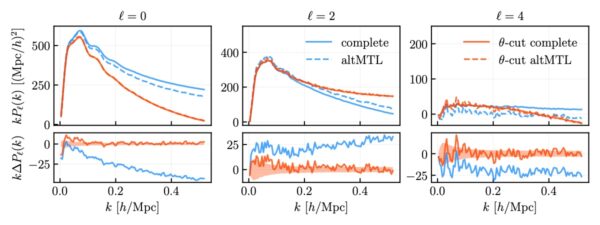
A more conservative approach relies on cutting out all the information arising from pairs of galaxies with angular separation smaller than θ ~ 0.05 degrees, corresponding to the angle covered by two neighboring fibers separated by 10.4 mm (see scheme below). We refer to this as the “θ-cut” method.
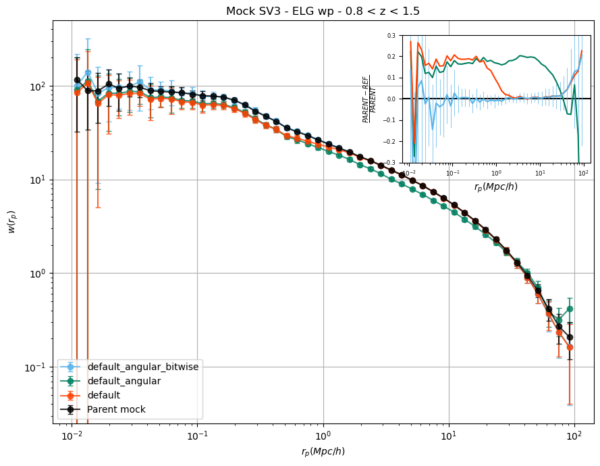
Paper 5 shows that by removing all the small pairs with angular separation θ < 0.05 degrees and imposing this condition in our models, we are able to completely remove the systematic uncertainty associated to fiber collisions, as demonstrated in the figure below.
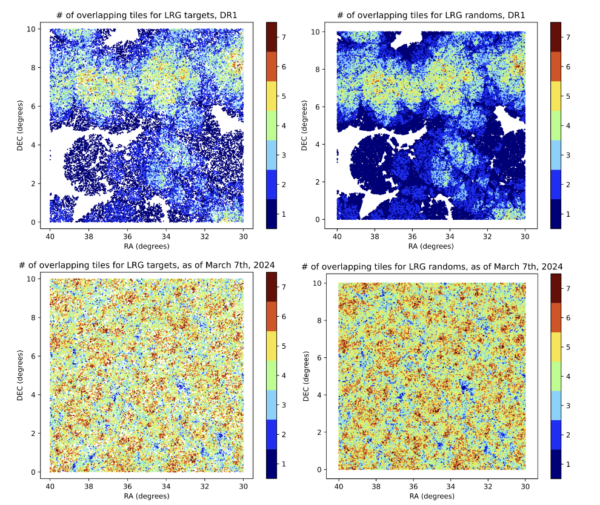
Finally, the results of all the weighting schemes presented until now come together in the LSS catalogue production pipeline presented in Paper 1. However, these different weights are not the end of the story, there are plenty of things to take into account. For instance, the fact that our observed galaxies are “incomplete”, means that in order to measure the actual clustering of galaxies, we cannot compare our map simply to a uniform distribution of galaxies. We need to compare to a random distribution of galaxies (without clustering) that matches exactly the sky area and mean density evolution with redshift of the DESI observations. This is tricky, given that some sky areas have yet been observed only once, while in other regions the observed tiles are overlapping to increase completeness.
To visualize this problem see here a figure from Paper 1. The left column shows actual observed galaxies and the right column shows the galaxies we would have observed if galaxies were distributed randomly, i.e., if there was no BAO scale or gravitational clustering at all! Our actual clustering measurements are always defined as the excess clustering of the data with respect to that random Sample. Also, it displays how the tiling pattern evolved between the first year of operations (upper row) up to a few weeks before today, i.e. almost three years of operations. As you can see, the three-year sample is much more regular, so we are already looking forward to perform cosmological analyses on that more complete Sample!
Modeling systematics
Decoupled from the systematics related to the instrument and observing condition, we also need to make sure that the theoretical systematic error budget arising from our cosmological models is under control. For the full-shape analysis, this has been studied in detail in the papers presented in our April 11 Guide, and for the BAO analysis from galaxies and quasars we tested the impact of the reconstruction scheme, the galaxy-halo connection and the BAO theory (for details, see our April 4 Guide.
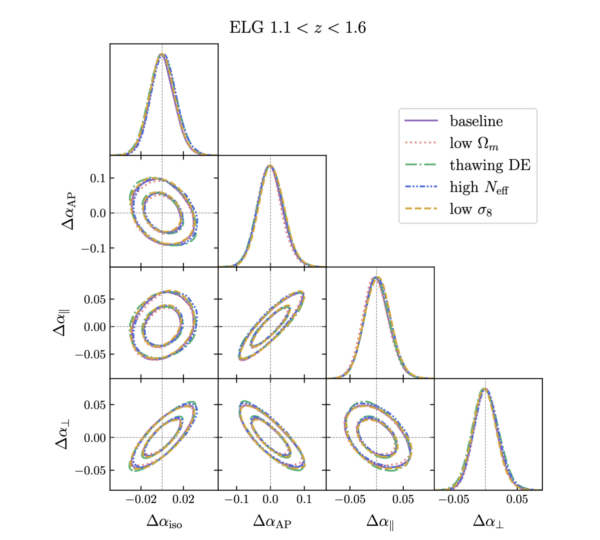
Today, we release an additional paper (Paper 9) presenting an in-depth study of the impact of the so-called “fiducial cosmology assumption” BAO analyses are subject to. In a nutshell, to perform the BAO analysis with galaxies and quasars, all redshift measurements must be transformed to Cartesian coordinates under the assumption of a fiducial cosmological model, such that we can measure the full three-dimensional clustering statistics. At the same time, a template for the BAO peak at a given fiducial value of the sound horizon must be used to infer the excess probability of clustering in units of the sound horizon. In theory, that quantity is independent of the fiducial cosmology, however, it is essential to explicitly test whether this is indeed the case in practice. In Paper 9, the authors test the robustness of the BAO measurements against the choice of fiducial cosmology for both cases (coordinates and templates) individually and deliver an estimate of the associated contribution to the systematic error budget in the context of the DESI DR1 BAO analysis. They conclude a contribution of 0.1% in the dilation parameters.
Blinding
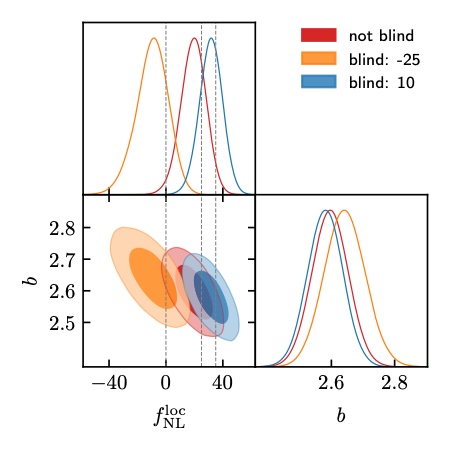
To shield ourselves from confirmation bias we decouple the analysis of systematic uncertainties presented before from the cosmological analysis by blinding the data at the catalog level until the cosmological analysis settings are determined. The Blinding scheme for BAO and RSD analyses has been presented in Paper 8 (see April 11 Guide). While that scheme works by displacing galaxies in their position along the line of sight, we implemented an independent catalog-level weighting scheme changing the galaxy density on large scales mimicking the presence of primordial non-Gaussianity (PNG).
Paper 6 presents the blinding scheme applied in DESI DR1 to mask the large scale dependent bias signal in the power spectrum that is generated by the presence of PNG. This is particularly relevant since the large scale modes of the power spectrum are heavily contaminated by the dependence on the imaging properties of the target density. With this blinding, we can therefore perform a confirmation bias free analysis and be able to provide a robust measurement compare to Planck18. Although DR1 data will not have the statistical power to reach similar constraints than Planck, one can expect competitive constraints with the final data set of DESI.
Conclusion
The set of papers published today mark an important milestone towards the cosmological analysis of our DESI 2024 DR1 Sample. The work that has been put into validating the LSS pipeline is invaluable for the full shape analysis yet to come and we are looking forward to unblinding our full-shape and RSD measurements very soon!