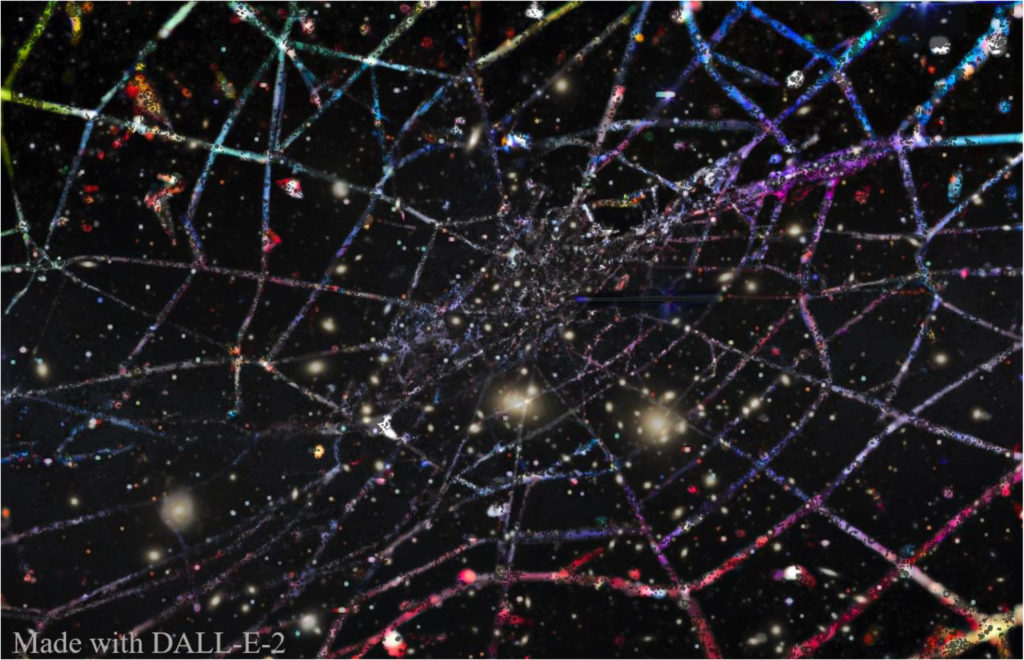
Even the smallest of correlations between galaxies and their environment can impact measurements on the largest scales.
Claire Lamman, Harvard University
September 9, 2022
 Understanding the largest structures in the Universe and how they evolve is more convoluted than just mapping out the positions of galaxies. This is because galaxy characteristics are not random; they are tangled both with how we choose targets and the underlying cosmic structure that we’re measuring. Interpreting DESI data involves carefully separating these threads, making sure to leave no loose ends.
An important idea to keep in mind is that DESI is not directly measuring the large-scale structure, because it’s mostly dark matter. Instead, we measure “tracers”: galaxies that trace the underlying web. It’s difficult to choose a sample of tracers which perfectly represent the true density. Certain properties of galaxies make them more likely to be observed, and these properties are often correlated with the structure itself. For instance, we’re more likely to observe big, luminous galaxies, which are more likely to be found in dense clusters.
These ideas are not new. Any survey must be careful when their measurement is correlated with the way they select their sample. Here’s a simple example:

The purpose of DESI is to measure out structure very accurately. This means it’s more important than ever to account for even tiny sources of bias, and it can get complicated. Another example is that denser regions have more active galaxies, which can have more distinct spectral lines that make them easier to get redshifts for. Or we can undersample galaxies in dense regions because they are so close together that DESI’s fibers may collide if we observe some at the same time. Yet another example is that we correct for the dust in our own galaxy, but the dust maps we use include a little bit of dust from beyond the Milky Way! This extragalactic dust is more likely to be found in dense regions, so we can end up over-correcting for dust in denser regions and over-estimate their mass.
Each bias must be carefully accounted for. This can be done by comparing our sample to similar surveys or simulations to check for systematic incompleteness. However, many effects must be carefully studied on their own, and there’s enough examples to fill many papers!
I recently finished one such study, about a bias created by the alignment of galaxy shapes. Elliptical galaxies tend to align themselves with density filaments. That is, their shapes stretch along the direction of strands in the cosmic web. This effect is very small, but becomes noticeable when sampling millions of galaxies. This is tied to target selection because DESI is slightly more likely to choose a galaxy that is pointed at Earth; this is the orientation where a galaxy’s light is the most concentrated on the sky. Therefore, we are more likely to observe galaxies which lie in strands that are parallel to our line of sight, and undersample galaxies in density strands stretching across our line of sight.
The contrast in galaxy clustering we measure in one direction versus another tells us how fast the cosmic web forms (Redshift Space Distortions). Galaxy alignments can bias our measurements of this by about 0.5%. Although this seems tiny, it could make the difference between competing models of dark energy. It’s called “precision cosmology” for a reason! Here is a version of my paper written for the general public.
Even small knots like galaxy alignment can tangle up our measurements, which is one reason you need a large team like DESI to unravel the cosmic web.