Bela Abolfathi, University of California Irvine
June 1, 2021
On May 17, DESI officially began a 5-year survey of the cosmos to study dark energy and its role in the accelerated expansion of the universe. Over the course of its survey, DESI will collect spectra from over 30 million galaxies across 11 billion years, a feat that will result in the largest 3D map of the universe ever created.
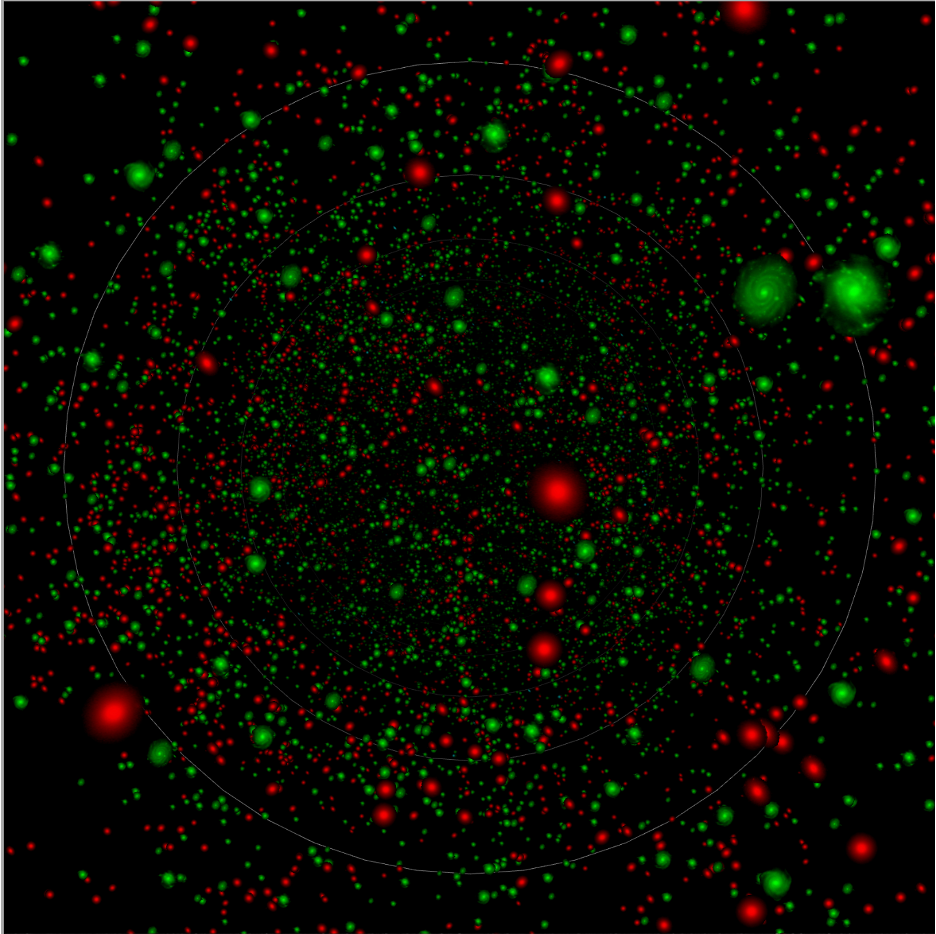
Prof. David Kirkby at UC Irvine created an interactive 3D visualization that helps put into perspective exactly how ambitious of an undertaking this is. The visualization linked to the image below shows around 30,000 galaxies observed during the survey validation phase—less than 0.1% of the galaxies DESI will eventually catalog—jam-packed into the space behind your palm held at arm’s length.

Each of the four types of galaxies specifically targeted by DESI are denoted by a separate color and correspond to bright galaxies (BGS), luminous red galaxies (LRG), emission-line galaxies (ELG), and quasars (QSO). These types populate different redshift regimes, as seen from the progression of colors over the course of the movie. That’s not to say that types are confined to select regions of redshift-space. Rather, they are targeted in this way because, once they’ve been redshifted to our telescope, their unique signatures fall into the 360-980 nanometer window registered by our detectors. In the case of high-redshift quasars, these objects are selected because they help reveal the distribution of matter in the intergalactic medium via the shadows they cast along their journey.
Like the opening crawl at the beginning of every Star Wars movie, the visualization starts in the nearby universe and takes us back in time to distances far, far away. Exactly how do we determine these distances? We start with each galaxy’s redshift, which we can measure from its observed spectrum. Both the composition and curvature of the universe will determine how fast it’s expanding, and by extension any notion of distance. We therefore need to assume a particular cosmological model in order to then transform from redshift to comoving distance.
The visualization defaults to using the fiducial values of 31% matter, 69% dark energy, and zero curvature. Changing these parameters will have a noticeable effect on the distance traveled as well as the age of the universe.
One of DESI’s main cosmological probes is baryon acoustic oscillations (BAO), the imprints of relic sound waves from the early universe. BAO is a standard ruler used to measure the scale at which galaxies tend to cluster. The concentric circles emanating from the center of the 3D visualization show the comoving 150 Mpc BAO scale at which we expect galaxies to cluster slightly more often compared to a random distribution of galaxies.
