On April 4, DESI released a set of papers marking our first release of year one (Y1) results. This page contains summaries of our main results and a guide to the publications. The papers will be available on arXiv at 5pm PST on April 4, and until then are available here.
Helpful links
- A press release containing a high-level overview of our main results: https://newscenter.lbl.gov/2024/04/04/desi-first-results-make-most-precise-measurement-of-expanding-universe/
- A brief announcement on our webpage: https://www.desi.lbl.gov/2024/04/04/first-cosmology-results-from-desi-most-precise-measurement-of-the-expanding-universe/
- A list of current papers: https://data.desi.lbl.gov/doc/papers/
- For more background on DESI’s science, see our public webpages.
- DESI’s Y1 data is not yet public, but you can find our early data release and any updates on this site: https://data.desi.lbl.gov/doc/releases/
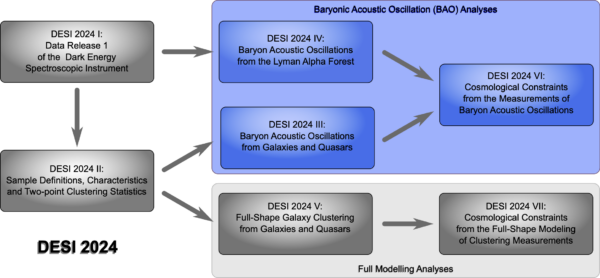
The Y1 results fall into seven main categories, three of these (highlighted in blue) are released on April 4:, BAO measurements with galaxies and quasars (DESI 2024 III), BAO with the Lyman-alpha forest (DESI 2024 IV), and cosmological inference from BAOs (DESI 2024 VI). This figure displays the publication organization with the results released on April 4 highlighted in blue, and summaries of each can be found below.


April 4 Paper Summaries
BAO Measurements from Galaxies and Quasars
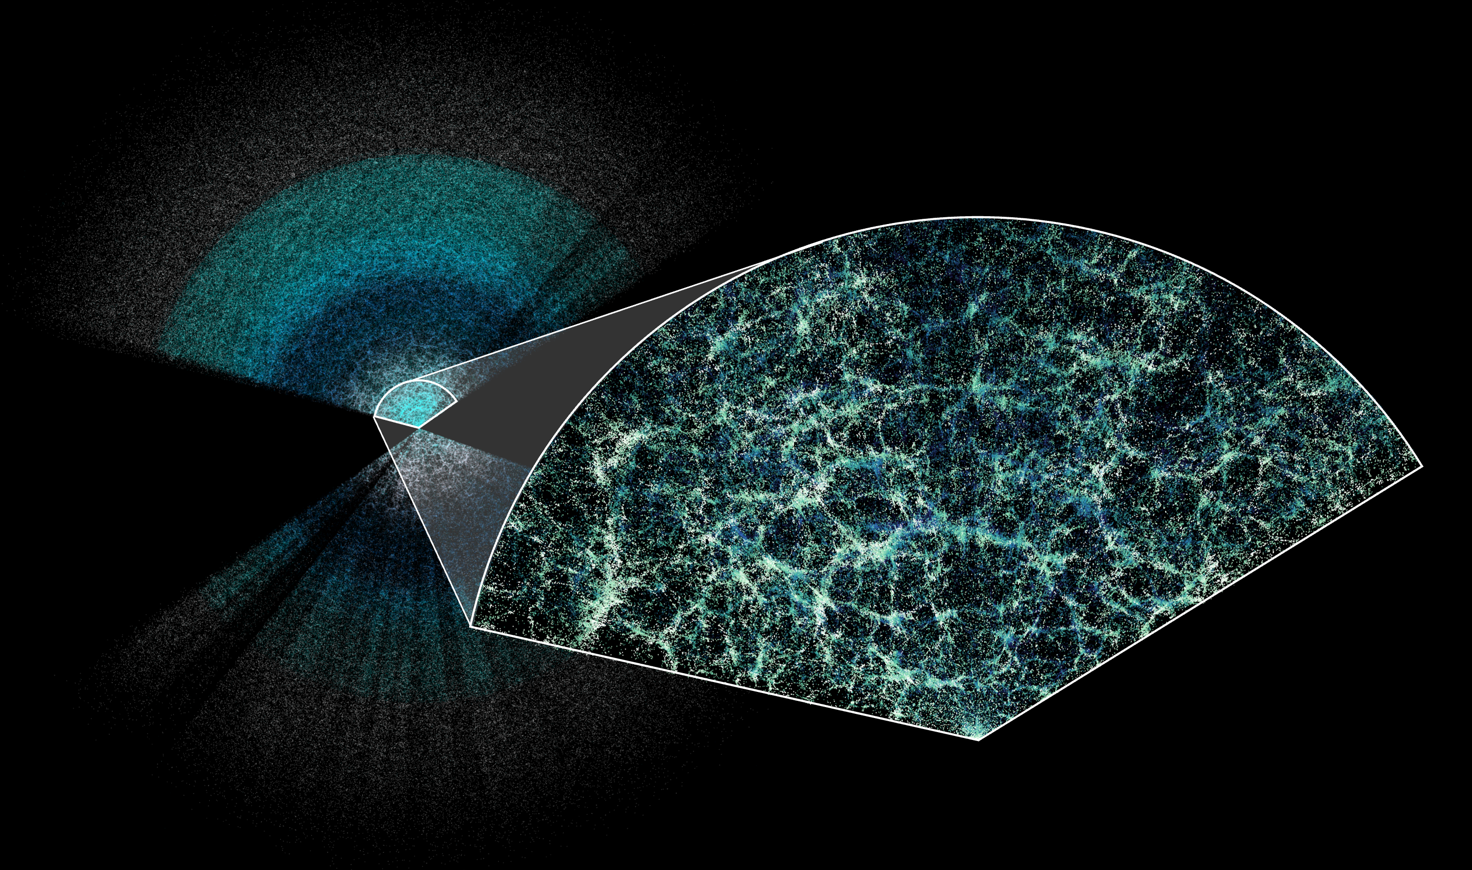
Baryon Acoustic Oscillations (BAO) are a powerful tool to measure cosmic expansion through the “standard rulers” created by expanding overdensities from the early universe. Using galaxies as tracers of these overdensities, this set of papers describe DESI’s galaxy BAO measurements. This is the largest dataset ever used to measure BAO, by both number of galaxies and volume. They are the most precise measurements of their kind, at 0.52%.
DESI 2024 III: Baryon Acoustic Oscillations from Galaxies and Quasars
Arxiv: 2404.03000
Summary: This is an overview of the main DESI Year-1 BAO results from galaxies and quasars.
Baryon Acoustic Oscillation Theory and Modelling Systematics for the DESI 2024 results (submitted in Feb 2024)
Corresponding author: Shi-Fan Chen
Arxiv: 2402.14070
Summary: Baryon acoustic oscillations are one of the best standard rulers there are. In this paper the authors work out just how robust they are, and how to best fit and extract the signal from DESI data.
Optimal reconstruction of baryon acoustic oscillations for DESI 2024
Corresponding authors: Enrique Paillas, Zhejie Ding, Xinyi Chen
Arxiv: 2404.03005
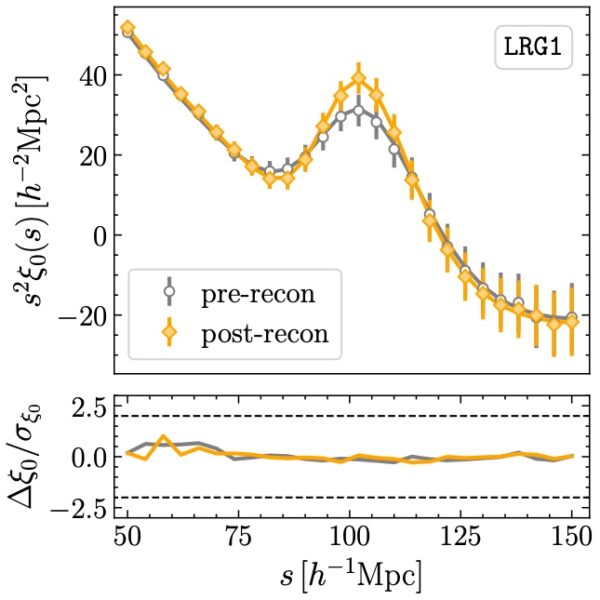
Summary: This paper investigates different reconstruction settings to optimize BAO detection. Reconstruction is a sophisticated technique enabling a more precise (lower statistical error) and more accurate (lower systematic error) BAO measurement. When considering the galaxy distribution, unfortunately the pristine BAO signal is slightly erased and contaminated by the galaxies’ velocity originating from their mutual gravitational interaction. Luckily, from the observed galaxy density we can calculate the gravitational potential at each galaxy and hence estimate their velocities. Using that estimate, we can displace each galaxy to its initial position and hence “reconstruct” the initial galaxy field exhibiting the original, pristine BAO signal. This work shows on Abacus mock catalogs that after applying reconstruction (post-recon) the BAO peak in the two-point correlation function is enhanced (see figure) and slightly shifted (not visible by eye in this figure) towards the location predicted by the cosmological model.
For non-cosmologists: the two-point correlation function is basically a histogram of the number of galaxy pairs that are separated by a distance “s”. It hence describes the excess probability of finding two galaxies separated by “s”.
Semi-analytical covariance matrices for two-point correlation function for DESI 2024 data
Corresponding author: Michael Rashkovetskyi
Arxiv: 2404.03007
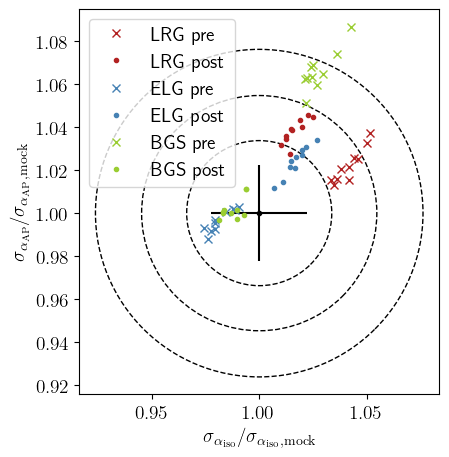
Summary: This work improves and validates an efficient method for generating covariance matrices for clustering analyses using the correlation functions. In particular, the authors report a close agreement in projected errorbars for BAO scale parameters between the mock-based (more standard) and semi-analytical (faster) covariance matrices, as shown in the right figure.
HOD-Dependent Systematics for Luminous Red Galaxies in the DESI 2024 BAO Analysis
Corresponding author: Juan Mena-Fernández
Arxiv: 2404.03008
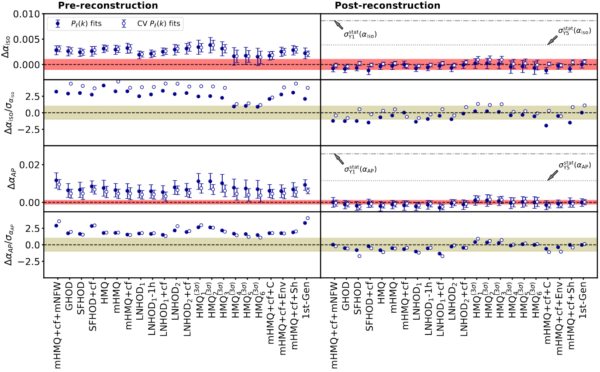
Summary: This paper investigates how the halo occupation distribution (HOD) modeling might affect the measurement of the BAO distance scale in the DESI Y1 analysis. This is done for LRGs, using several sets of Abacus simulations (that rely on dark matter only) with different HOD models (that populate dark matter halos with galaxies) in order to estimate the amplitude of the so-called HOD systematics. This work finds that the BAO measurements are robust enough against these kinds of systematics for the DESI 2024 analysis, and provides the estimated error budget.
HOD-Dependent Systematics for Emission Line Galaxies in the DESI 2024 BAO analysis
Corresponding author: Cristhian Garcia-Qunitero
Arxiv: 2404.03009
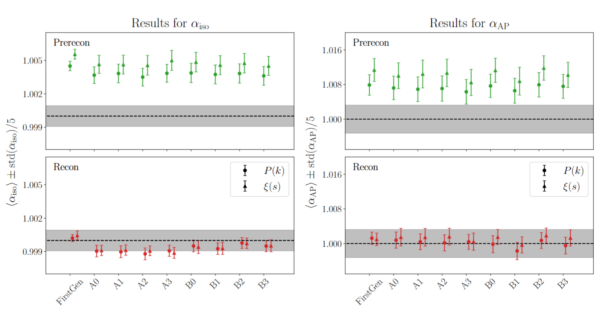
Summary: This paper consists of a series of tests to assess the robustness of the BAO analysis against HOD-dependence in the ELG tracer, and compare the differences found with the forecasted error with one year of DESI data.
We found that our BAO fits are robust enough against this systematics for DESI 2024 results and provide the error budget for this particular systematics.
BAO with the Lyman-alpha forest
The Lyman-alpha forest refers to absorption lines in the light of distant quasars, which reveal the distribution of gas along the line of sight. This allows DESI to extend our BAO analysis beyond the galaxy tracers and measure the most ancient BAO signatures, up to when the Universe was just ⅕ its current age. DESI’s Y1 results provide measurements of the isotropic BAO scale at 1.1% precision, the most precise measurement in the redshift ranges of 2 < z < 4.
DESI 2024 IV: Baryon Acoustic Oscillations from the Lyman Alpha Forest
Arxiv: 2404.03001
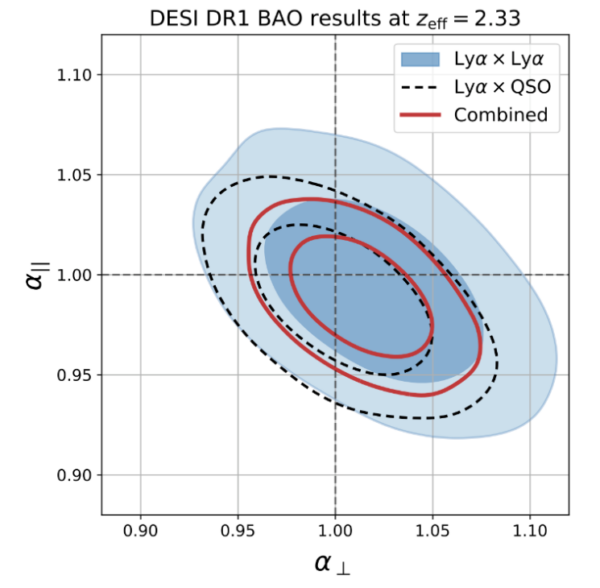
Summary: This is the main paper for BAO with the Lyman Alpha Forest, presenting the Lyman Alpha forest BAO measurement from over 420,000 spectra and their correlation with >700,000 quasars at an effective redshift of z=2.33.
The Lyman-α forest catalog from the Dark Energy Spectroscopic Instrument Early Data Release (published in December 2023)
Corresponding author: César Ramírez-Pérez
Article: https://academic.oup.com/mnras/article/528/4/6666/7462317?login=false
Summary: This publication presents and validates the Lyman-alpha forest fluctuations in the first DESI data release. To accomplish this measurement, the continua of DESI quasars were fitted not only in the Lyman-alpha forest region but also in featureless regions to the right of the Lyman-alpha emission line, which were used for calibration.
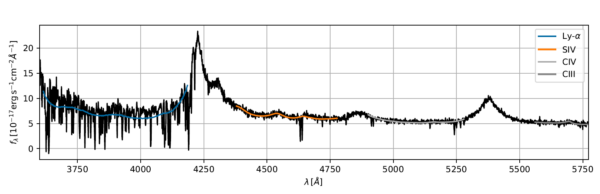
The image displays the observed flux (black) of a high-SNR DESI quasar. The different coloured lines show the expected flux for each of the regions (quasar continuum corrected by the mean absorption), for the Lyman-alpha forest region and the SIV, CIV and CIII calibration regions.
3D Correlations in the Lyman-α Forest from Early DESI Data (published in November 2023)
Corresponding author: Calum Gordon
Article: https://iopscience.iop.org/article/10.1088/1475-7516/2023/11/045
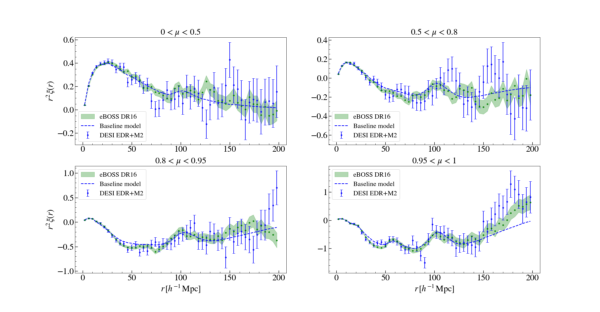
Summary: This is the first analysis of 3D Lyman-a correlations in early DESI data. The BAO peak is strongly detected, and the results are in good agreement with previous analyses of Lyman-a forest correlations from eBOSS. The figure here shows the measured auto-correlation in bins of mu = r_parallel / r, including eBOSS and DESI early data, and the best-fitting model.
Synthetic spectra for Lyman-α forest analysis in the Dark Energy Spectroscopic Instrument (submitted in January 2024)
Corresponding author: Hiram K. Herrera-Alcantar
Arxiv: 2401.00303
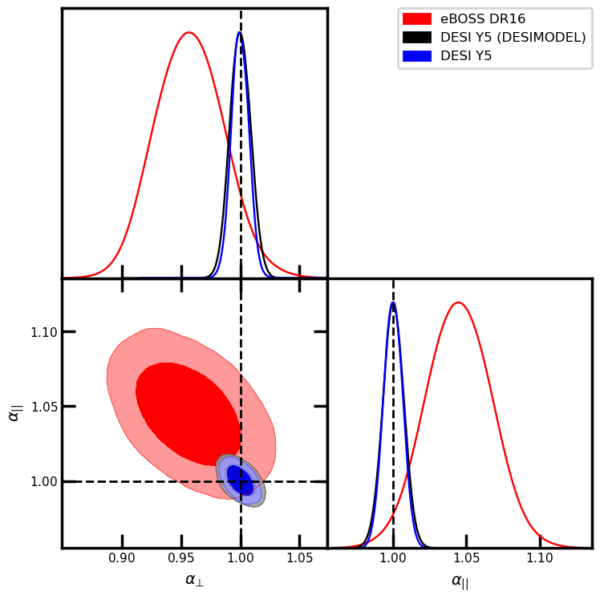
Summary: This paper presents the methodology followed to produce synthetic DESI Lyman-𝛼 datasets. We include all the steps from the raw transmitted flux generation to the addition of a continuum and instrumental noise to spectra. We perform a qualitative comparison of the results of DESI EDR+M2 simulated and observed data. And present a Forecast of the full DESI survey constraining power (show in figure).
Impact of Systematic Redshift Errors on the Cross-correlation of the Lyman-α Forest with Quasars at Small Scales Using DESI Early Data (submitted in February 2024)
Corresponding author: Abby Bault
arxiv: 2402.18009
Summary:
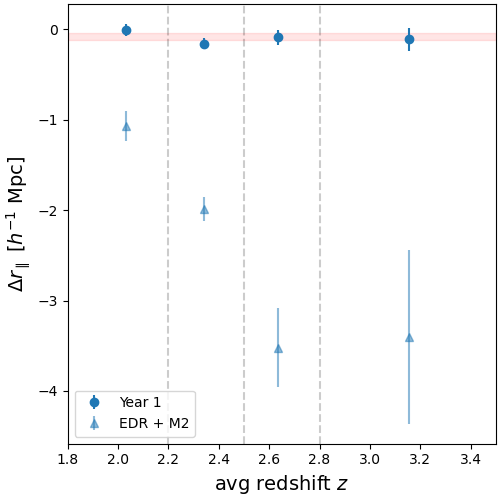
This publication presents a measurement of the systematic redshift errors from the DESI EDR+M2 quasar sample. We find evidence for a redshift-dependent bias causing redshifts to be underestimated with increasing redshift. This bias stems from the templates used for redshift estimation in the EDR+M2 sample. After deriving new templates for the DESI Year 1 quasar sample we repeat our analysis and no longer find evidence of a bias.
The image shows the measured redshift errors for the EDR+M2 and Year 1 samples when the catalog is cut into four redshift bins. For the EDR+M2 data (light blue triangles) there is a clear trend where the measured errors increase with increasing redshift. For the Year 1 data (dark blue circles) this bias is no longer present. The measured error for the full Year 1 catalog, shown in the light red region, also shows that the bias has been mitigated.
Characterization of contaminants in the Lyman-alpha forest auto-correlation with DESI
Corresponding authors: Julien Guy, Satya Gontcho A Gontcho
Arxiv: 2404.03003
Summary: This paper studies the signal introduced by the instrumental processing of the data that contaminates the signal detected from the Lyman Alpha Forest (neutral hydrogen clouds). In addition, it also studies the signal introduced by clouds of other chemical species (not neutral hydrogen) that contaminates the Lyman Alpha Forest signal. The conclusion of this paper is a thorough characterization of the instrumental and astrophysical contaminants of the Lyman Alpha Forest signal.
Validation of the DESI 2024 Lyα forest BAO analysis using synthetic dataset
Corresponding author: Andrei Cuceu
Arxiv: 2404.03004
Summary: This paper documents the creation of mocks for the Lyman-alpha BAO validation, validation of the pipeline using those mocks.
Broad Absorption Line Quasars in the Dark Energy Spectroscopic Instrument Early Data Release (submitted in September 2023)
Corresponding authors: Simon Filbert, Paul Martini
arxiv: 2309.03434
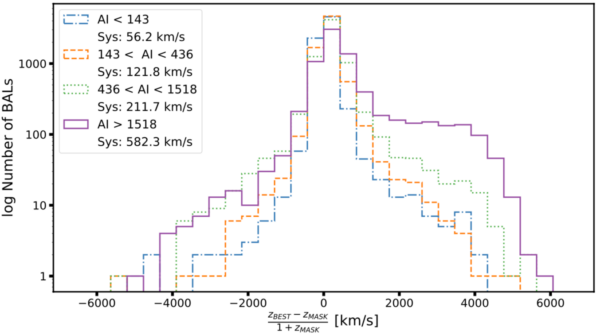
Summary: Broad absorption line (BAL) quasars can have significant absorption troughs near or coincident with the locations of some of the most prominent emission lines in quasar spectra. This paper presents a study of the impact of these features on how accurately we can measure the recession velocity (or redshift) of BAL quasars and presents strategies to mitigate their impact. The figure shows the differences in the redshift before and after mitigating the impact of the BAL features for various types of BALs.
Cosmological Inference
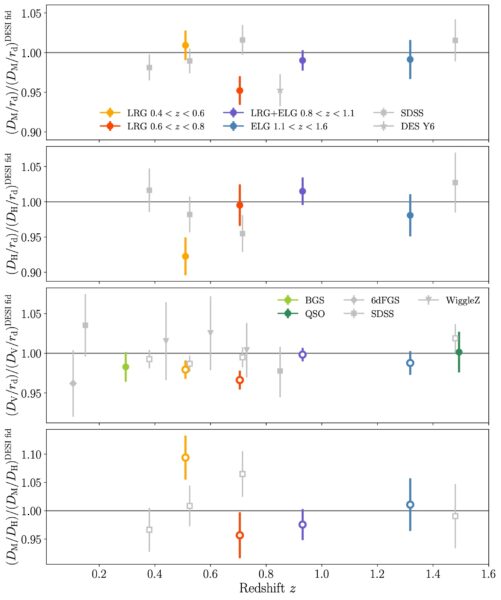
This final paper interprets the analysis documented above. DESI’s Year one BAO measurements constrain the density of matter in the universe, Ωm, and the rate of expansion of the universe, H, relative to the sound horizon, r_d. These measurements reveal the growth rate of the universe over time, and, consequently, the impact of dark energy.
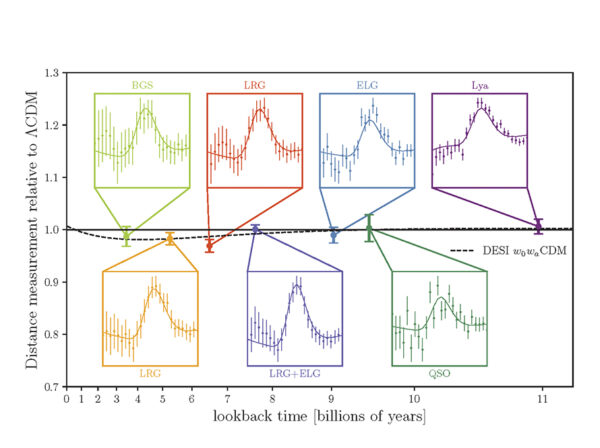
Image Credit: Arnaud de Mattia/DESI collaboration
DESI 2024 VI: Cosmological Constraints from the Measurements of Baryon Acoustic Oscillations
Arxiv: 2404.03002
Summary: This paper analyzes the BAO measurements from all tracers, which are complementary to each other. The results are consistent with SDSS and CMB measurements. DESI’s measurements are compatible with the standard cosmological model, LCDM, but slightly prefer a model of dark energy which evolves with time.