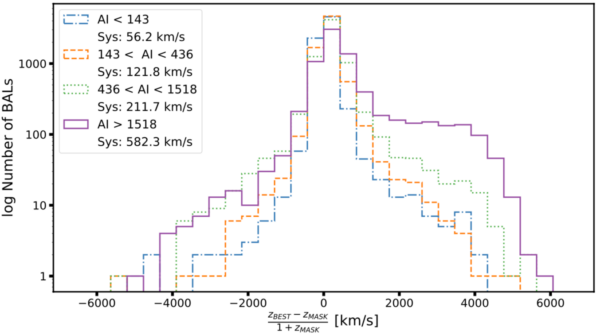
Joan Najita (NOIRLab)
30 May 2024
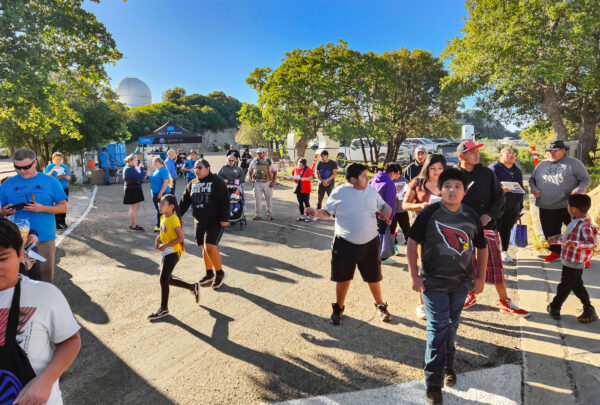
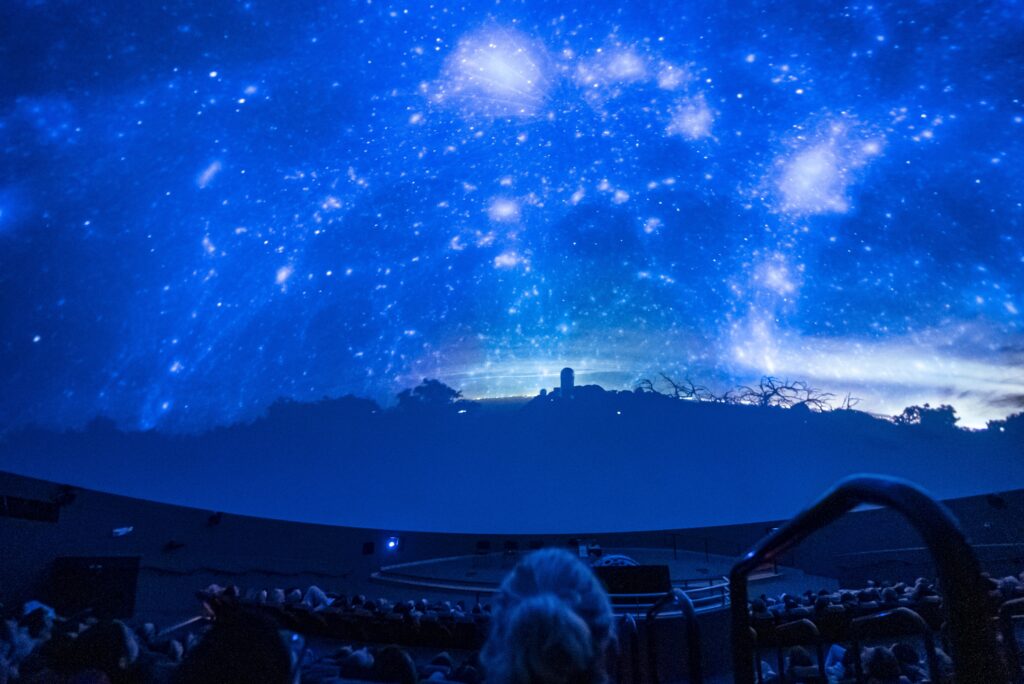
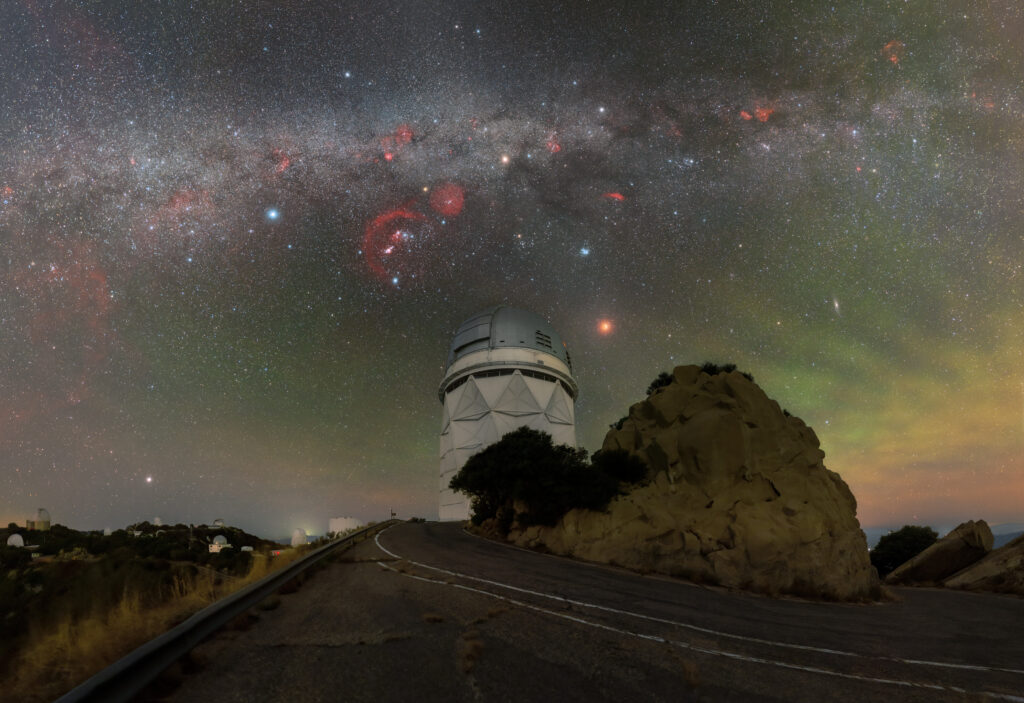
This past weekend, Kitt Peak National Observatory (KPNO) hosted an Open Night for members of the Tohono O’odham Nation. KPNO, where the DESI project is underway, is located atop I’oligam Du’ag (Manzanita Shrub Mountain) in the Tohono O’odham homeland. KPNO Open Nights celebrate the relationship between the Nation and the Kitt Peak astronomy community and express the community’s appreciation for the privilege of carrying out research at a site that is of deep historical and cultural significance to the Nation.
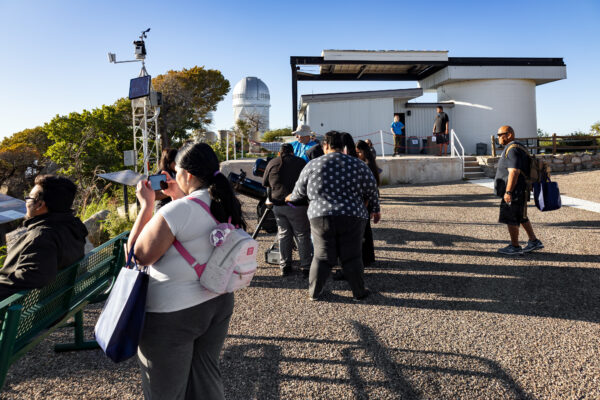
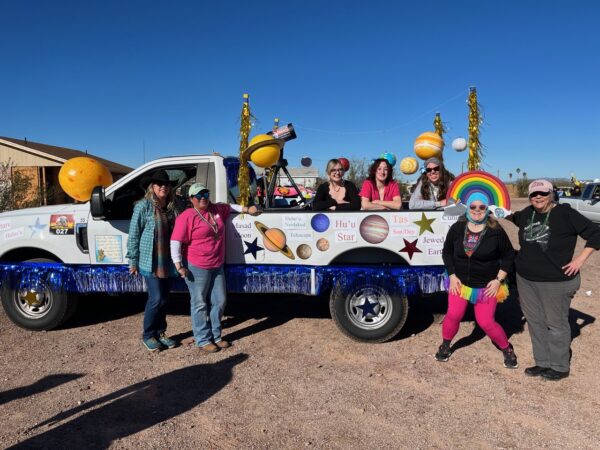
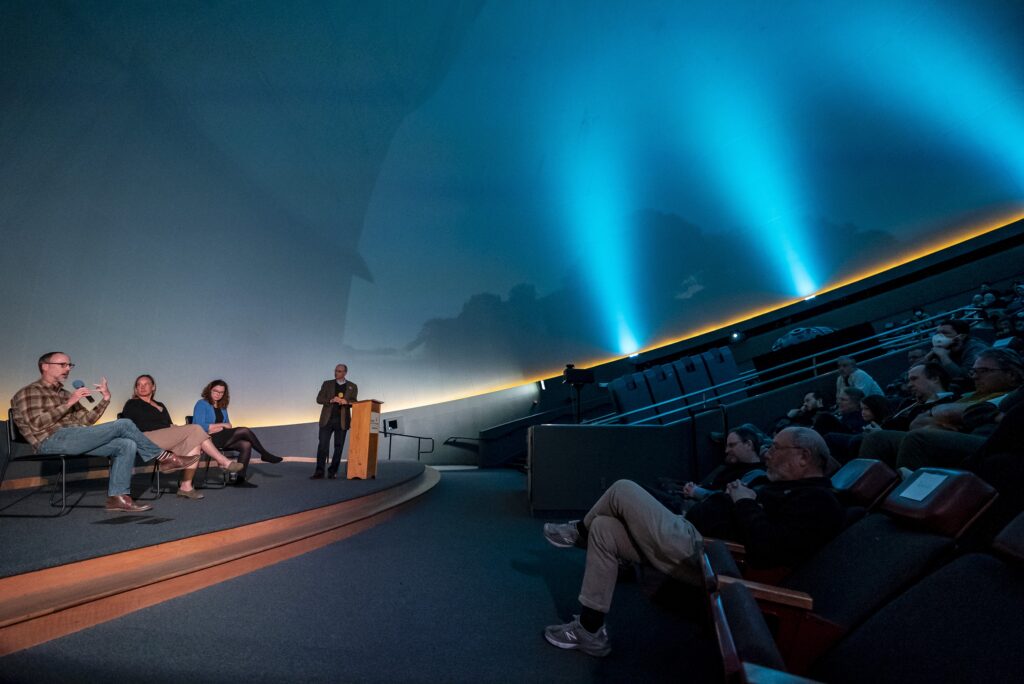
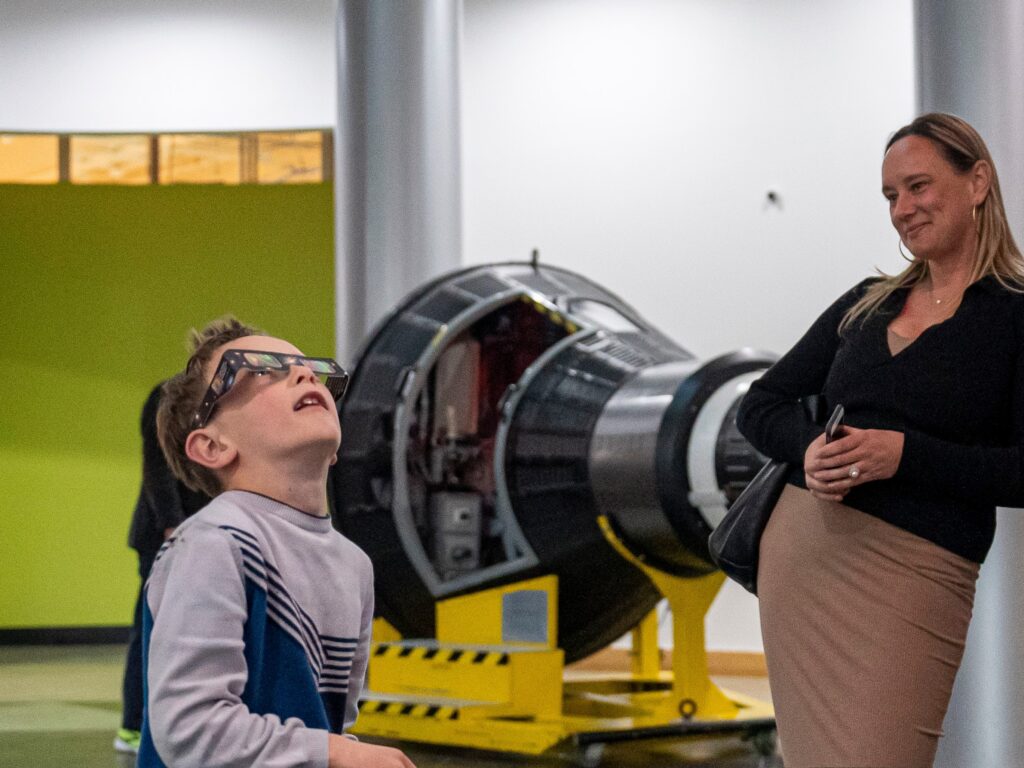
For the 25 May 2024 event, KPNO opened its doors, welcoming 600 Tohono O’odham community members to the observatory. Tribal members of all ages joined in a wide variety of activities, including solar and night-time telescope viewing, Waila music, hands-on activities, and observatory tours.
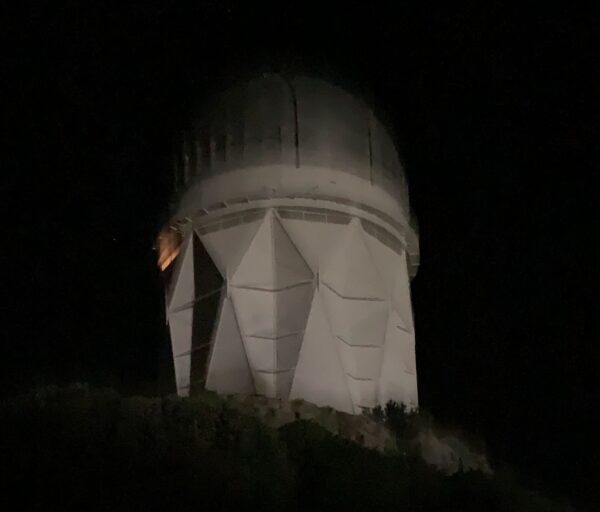
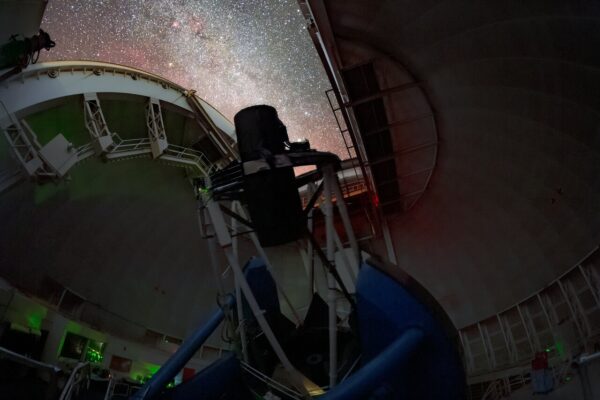
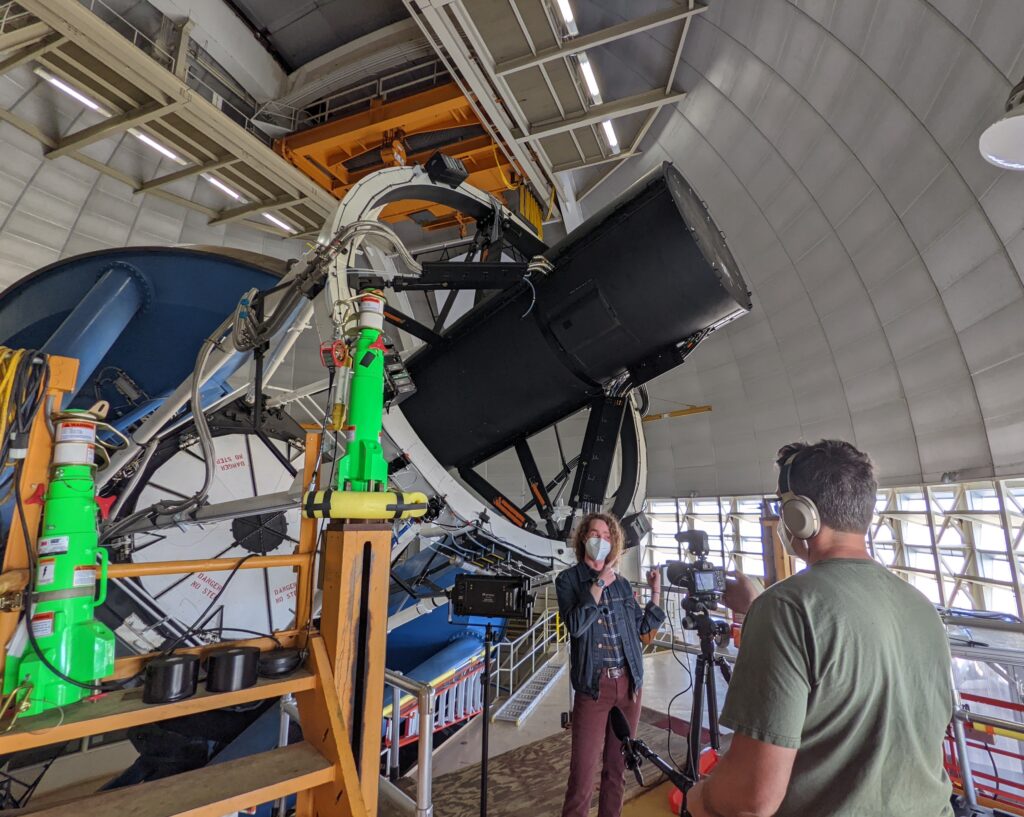
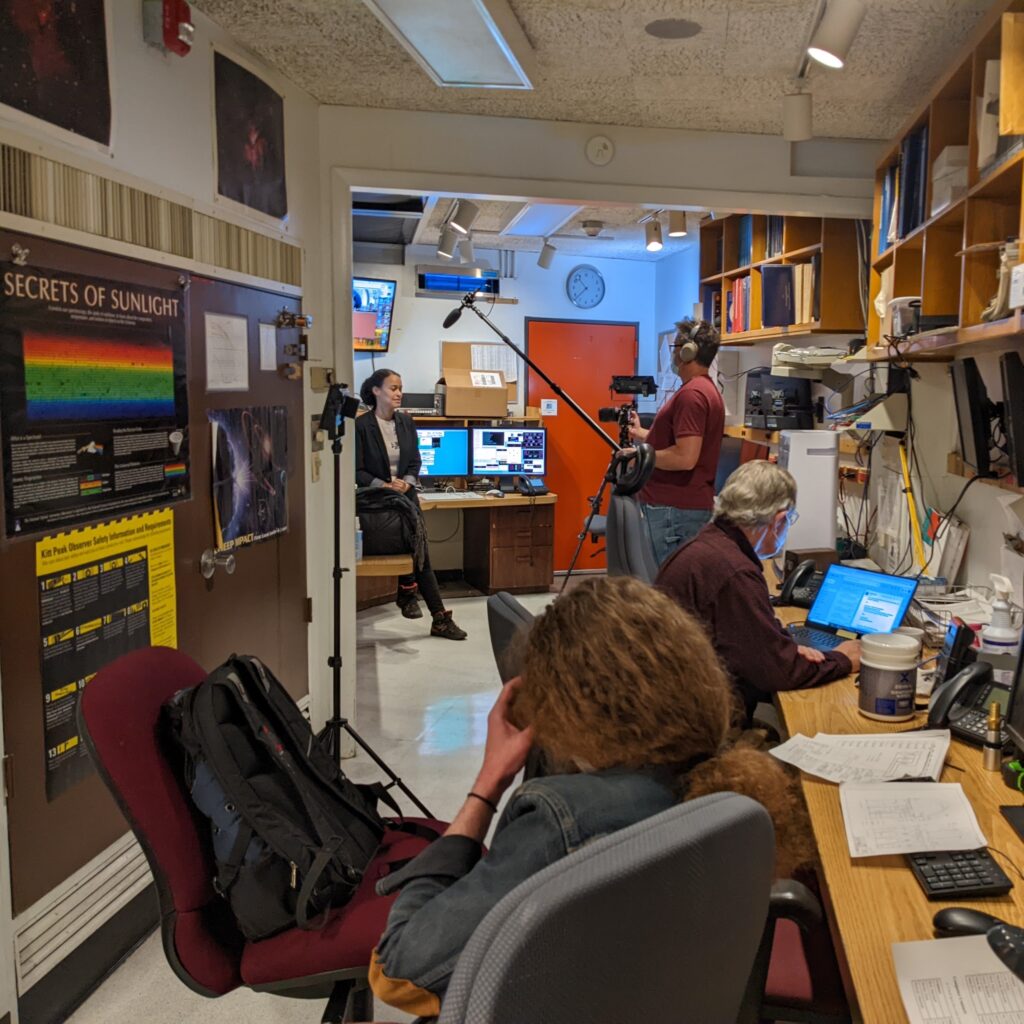
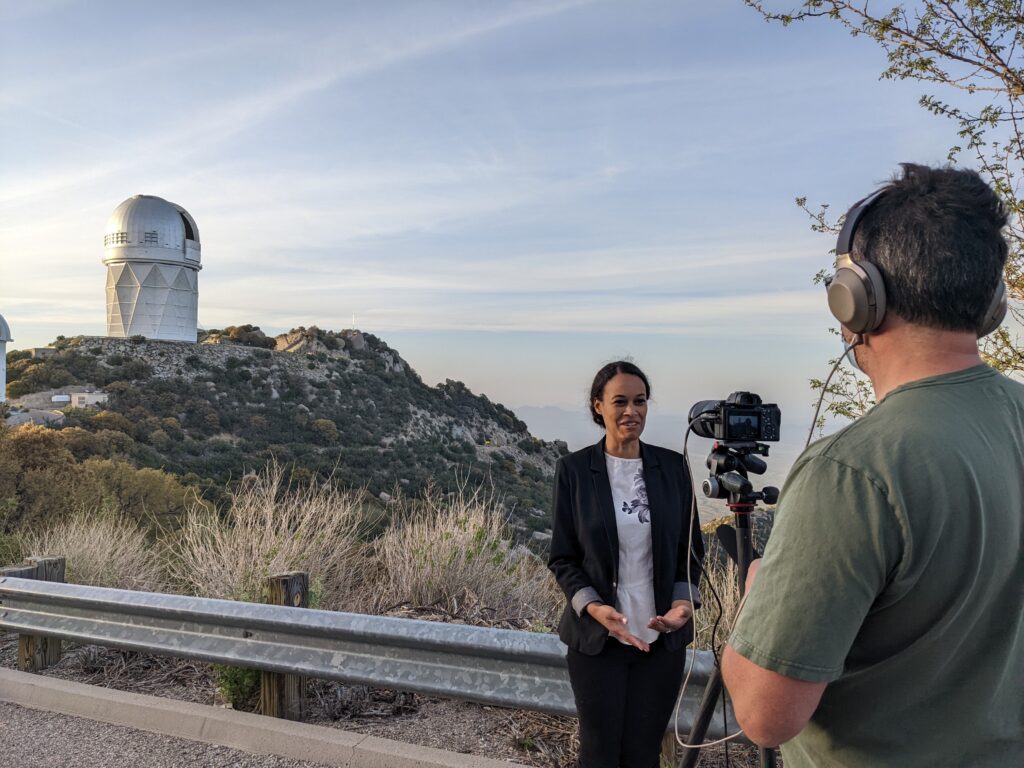
Visitors to the 4m Mayall Telescope were greeted by volunteers — including DESI collaboration members Dick Joyce, Luke Tyas, Chris Brownewell, Bob Stupak, Yuanyuan Zhang, and Joan Najita — who described the DESI project, its amazing technology and goals, and how the observations are carried out. Elsewhere on the mountain, DESI collaboration member and Mid-Scale Observatories Director Lori Allen greeted visitors as they arrived and helped them view highlights of the night sky through a small telescope.
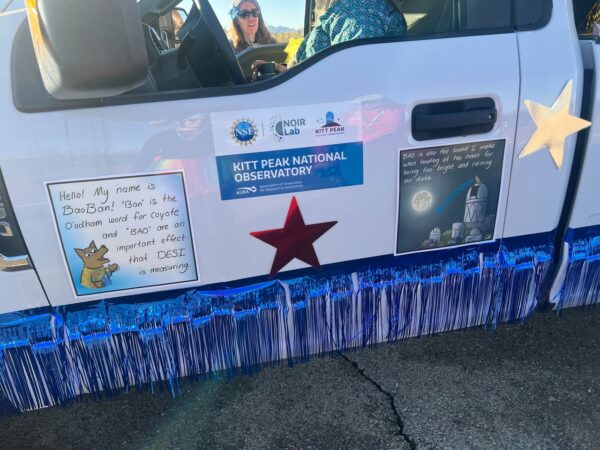
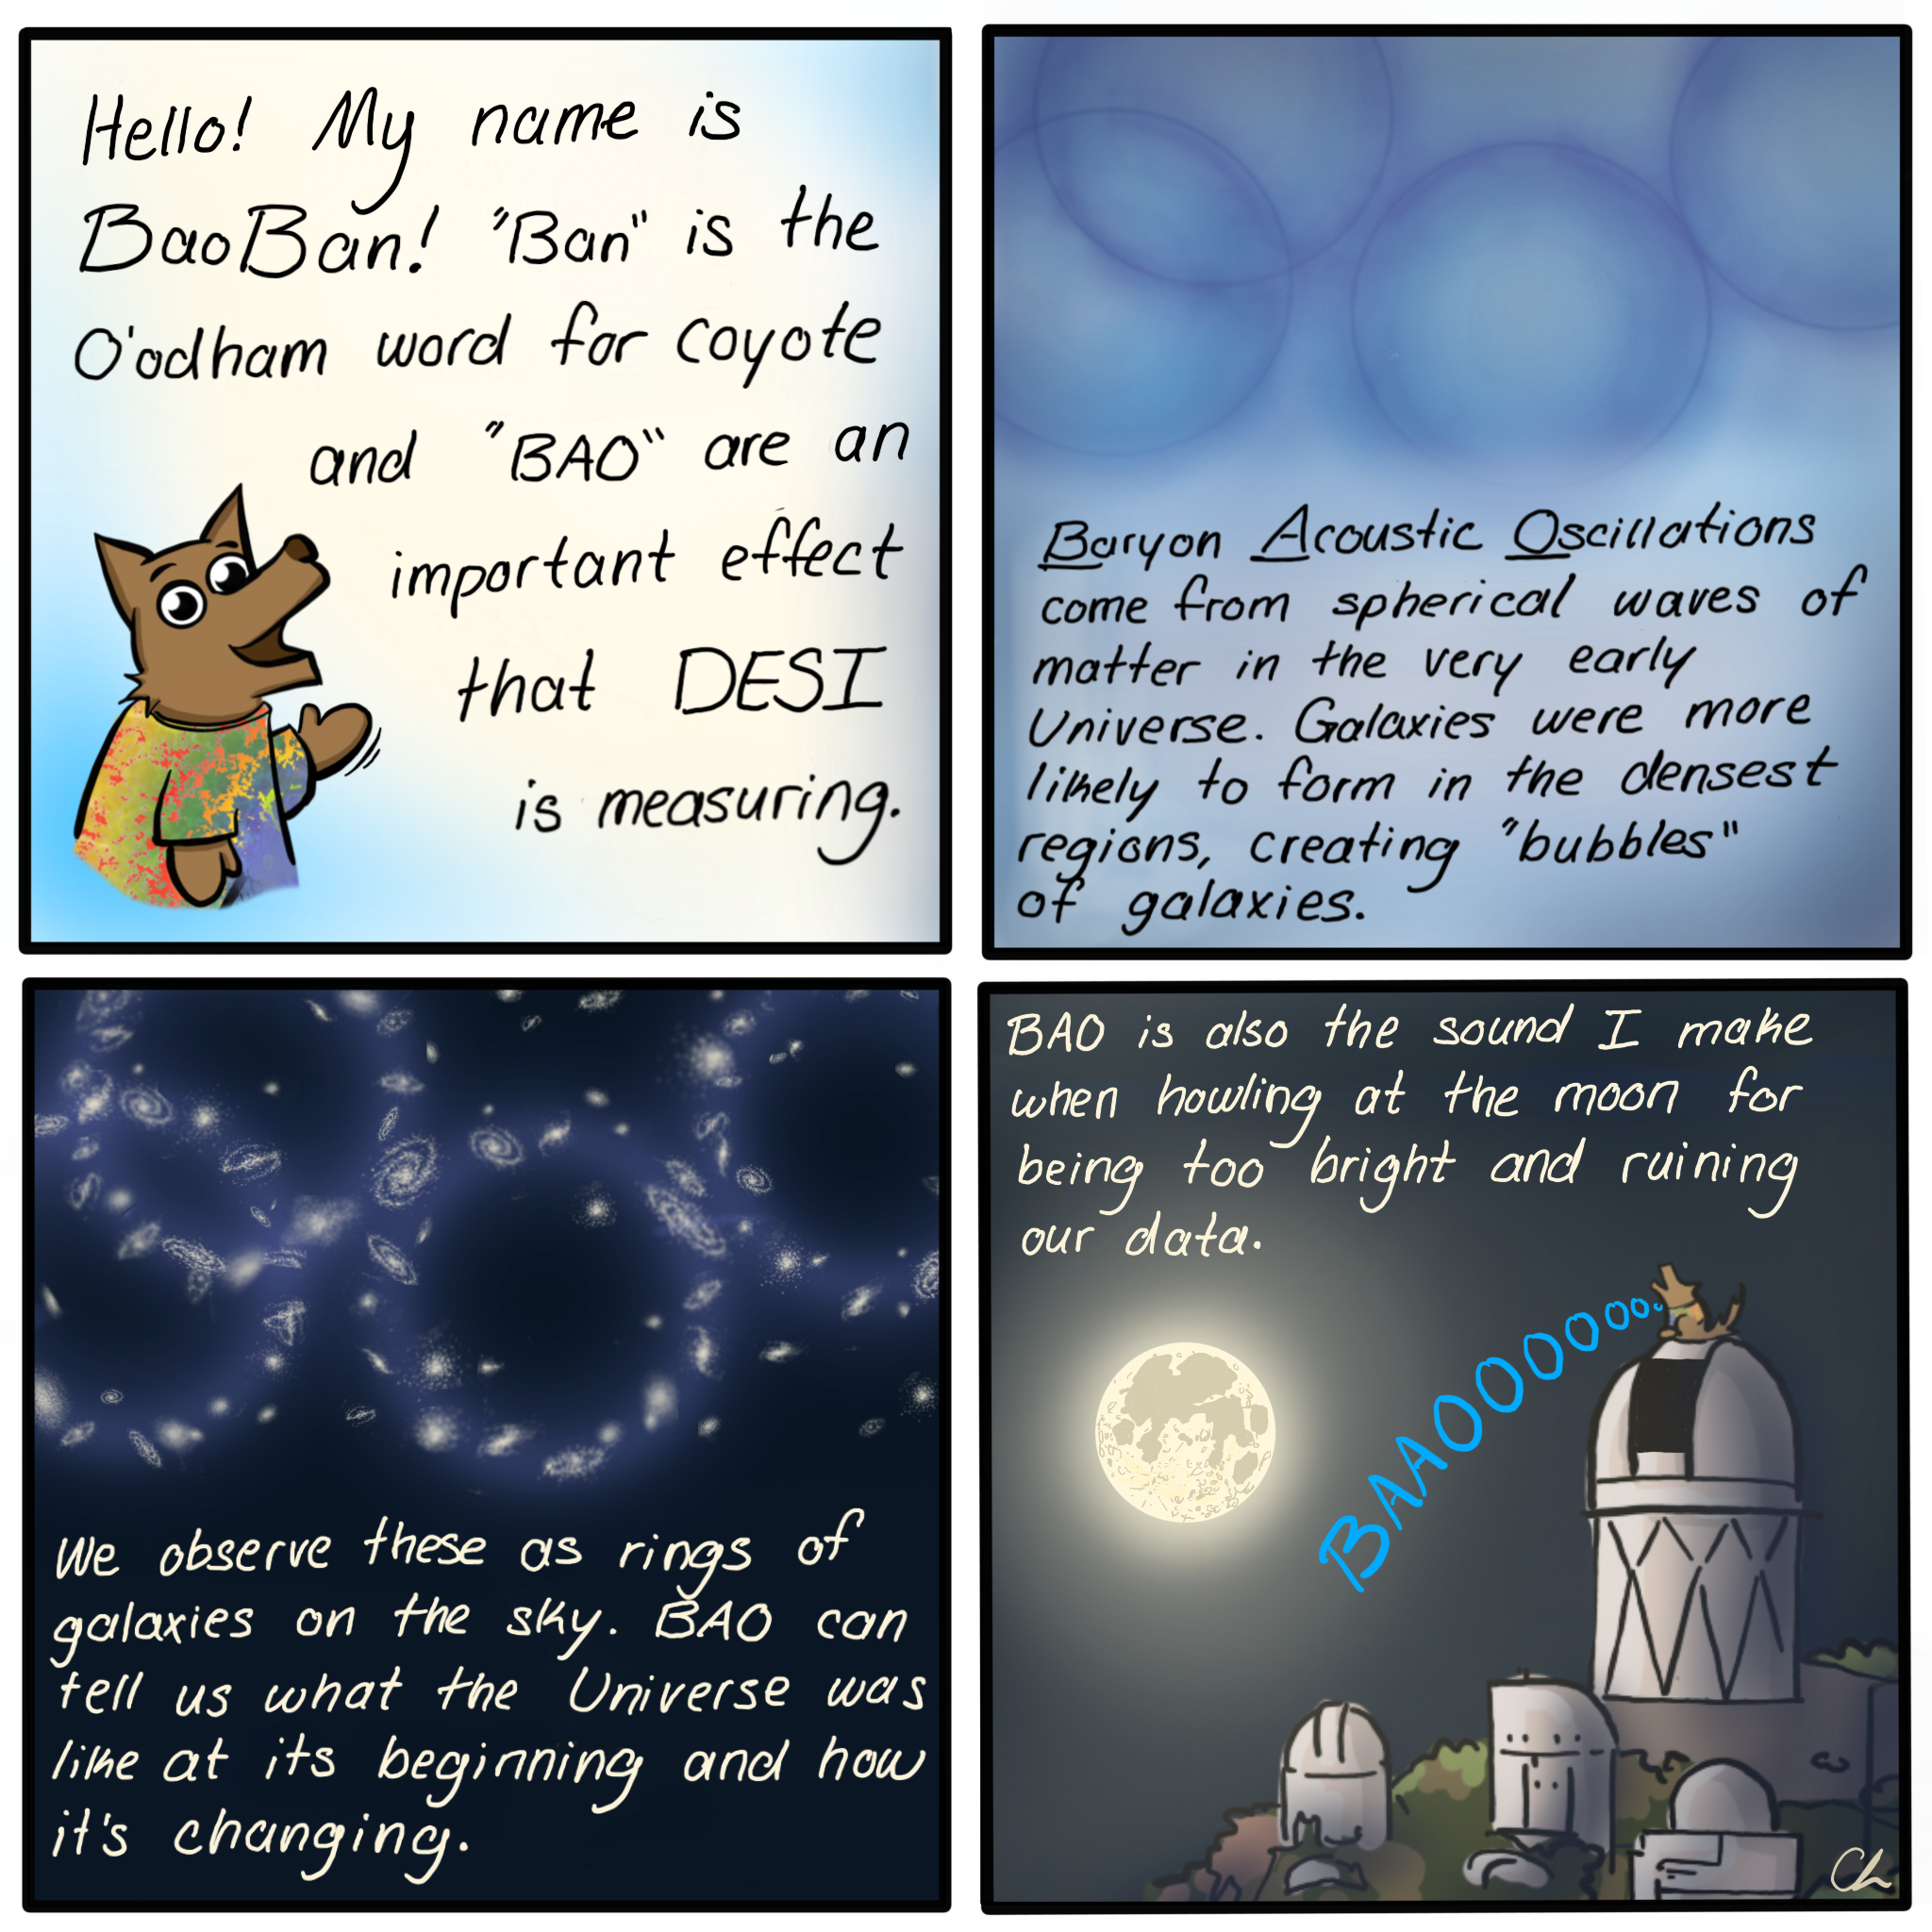
BaoBan, DESI’s ambassador for Education and Public Outreach, made several guest appearances. A coyote from the wilds of Arizona, BaoBan appeared on DESI-themed souvenir postcards created for the event and in the inaugural KPNO Newsletter for the Tohono O’odham Nation, both of which were distributed to visitors. BaoBan has previously appeared at the Tohono O’odham Rodeo, in comic strips, and other DESI-related public engagement activities.
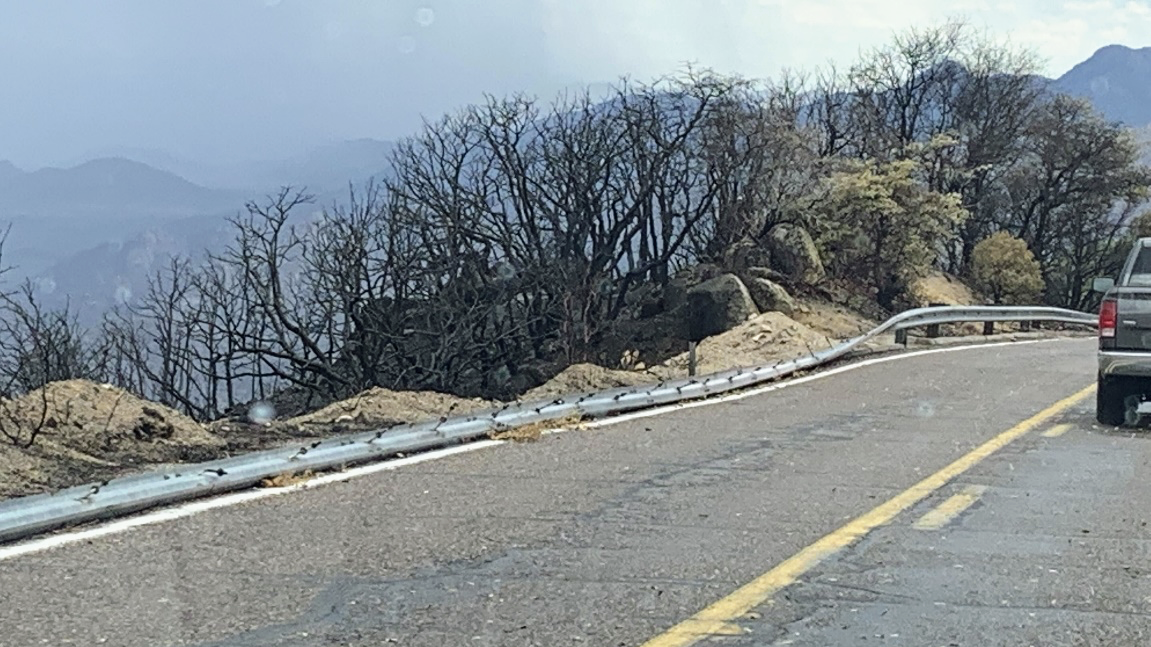
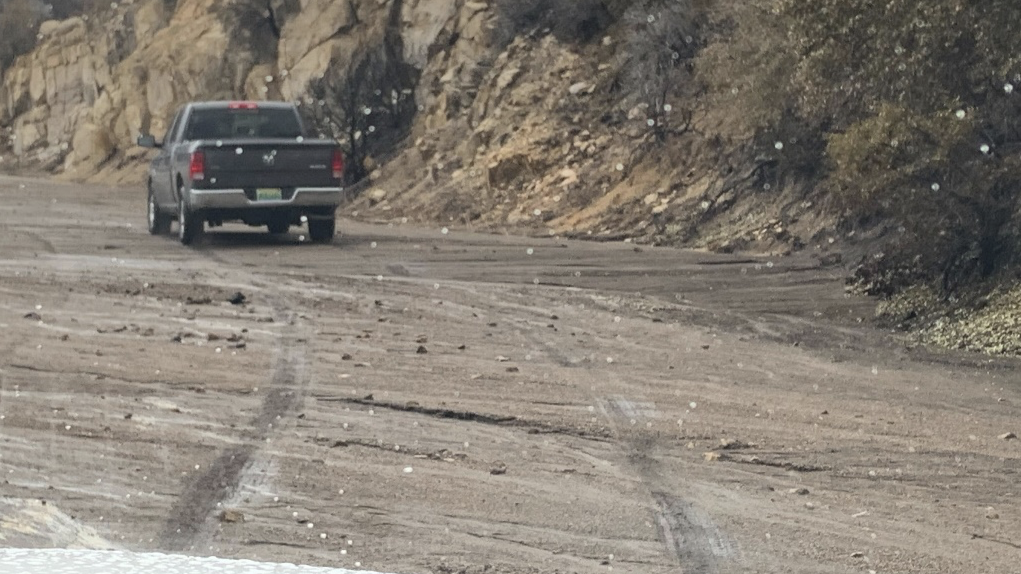
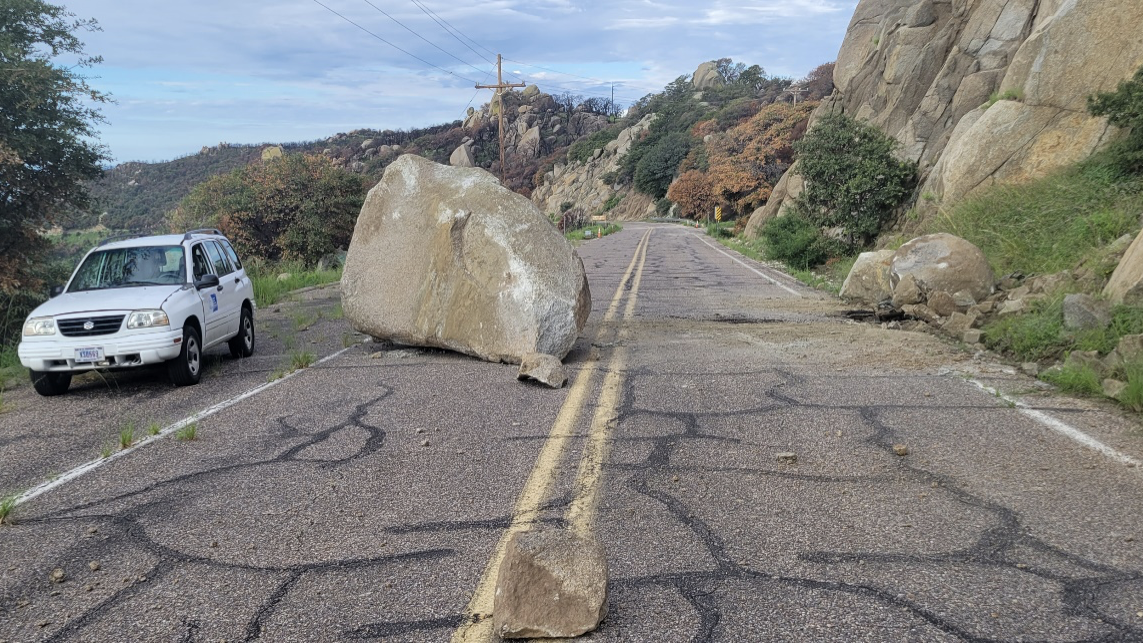
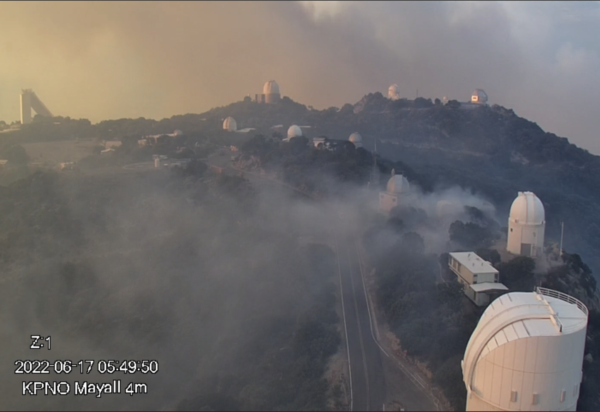
The 25 May Open Night was long anticipated, with the recent coronavirus pandemic and Contreras fire of 2022 having disrupted the usual 2-3 year cadence of these events. With the mountain now reopened and normal observatory operations resumed, the Kitt Peak astronomy community was eager to restart the series. More than 70 volunteers from NOIRLab and Kitt Peak facilities worked together with local Tucson community organizations in hosting the event.
For Bob Stupak, NOIRLab Electronics Technician and DESI collaboration member, welcoming visitors at the Mayall was “a great time,” an opportunity to share the excitement of DESI with the community, resulting in smiles all around. He noted, “I was working at the top of the visitor’s elevator and everyone leaving the building seemed to have been really impressed.”
Further details about the event are available in a NOIRLab press release.
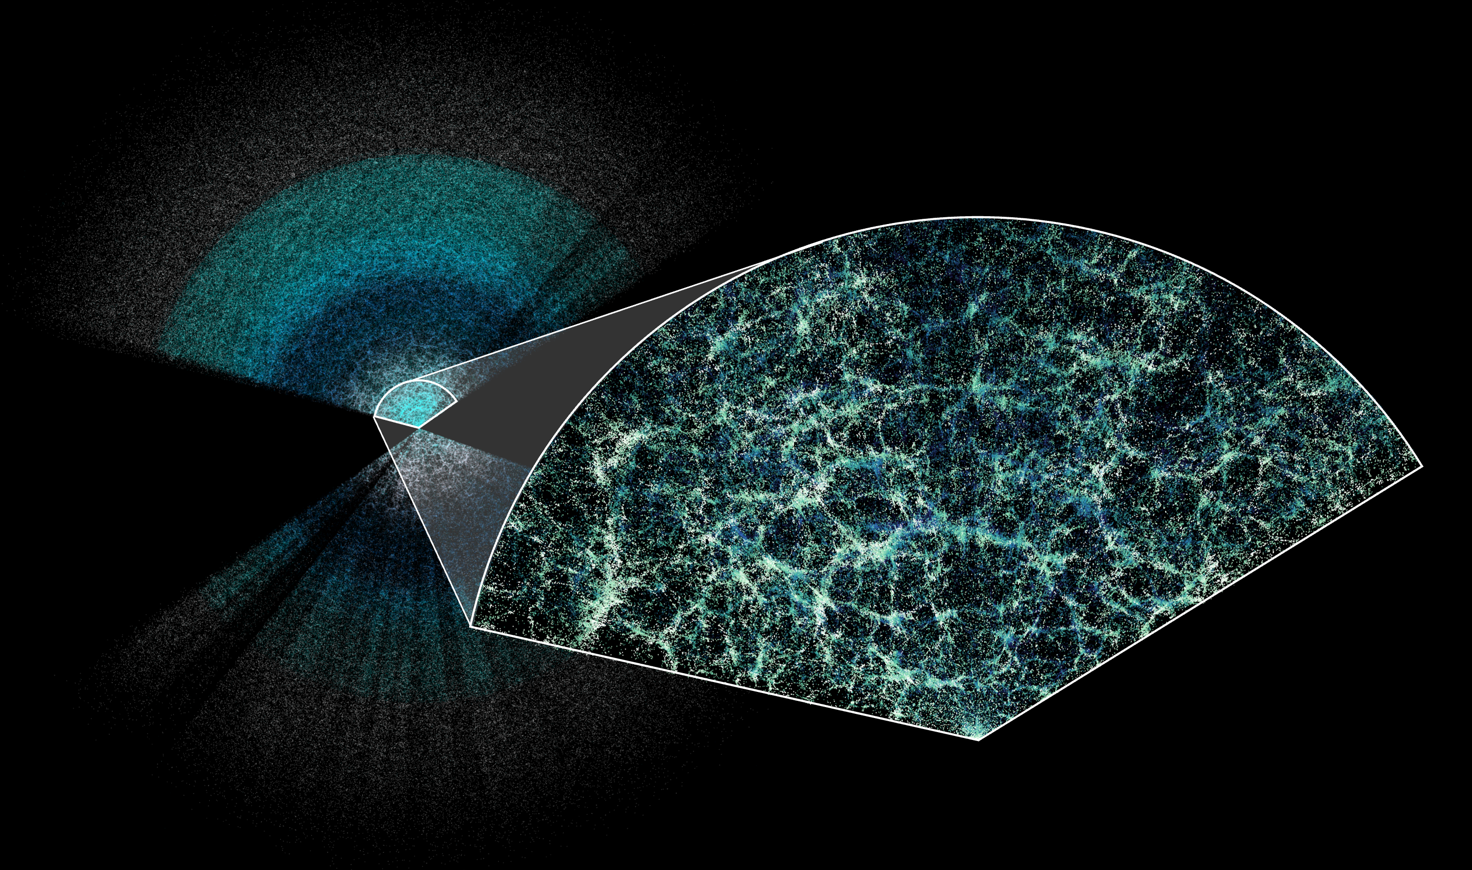


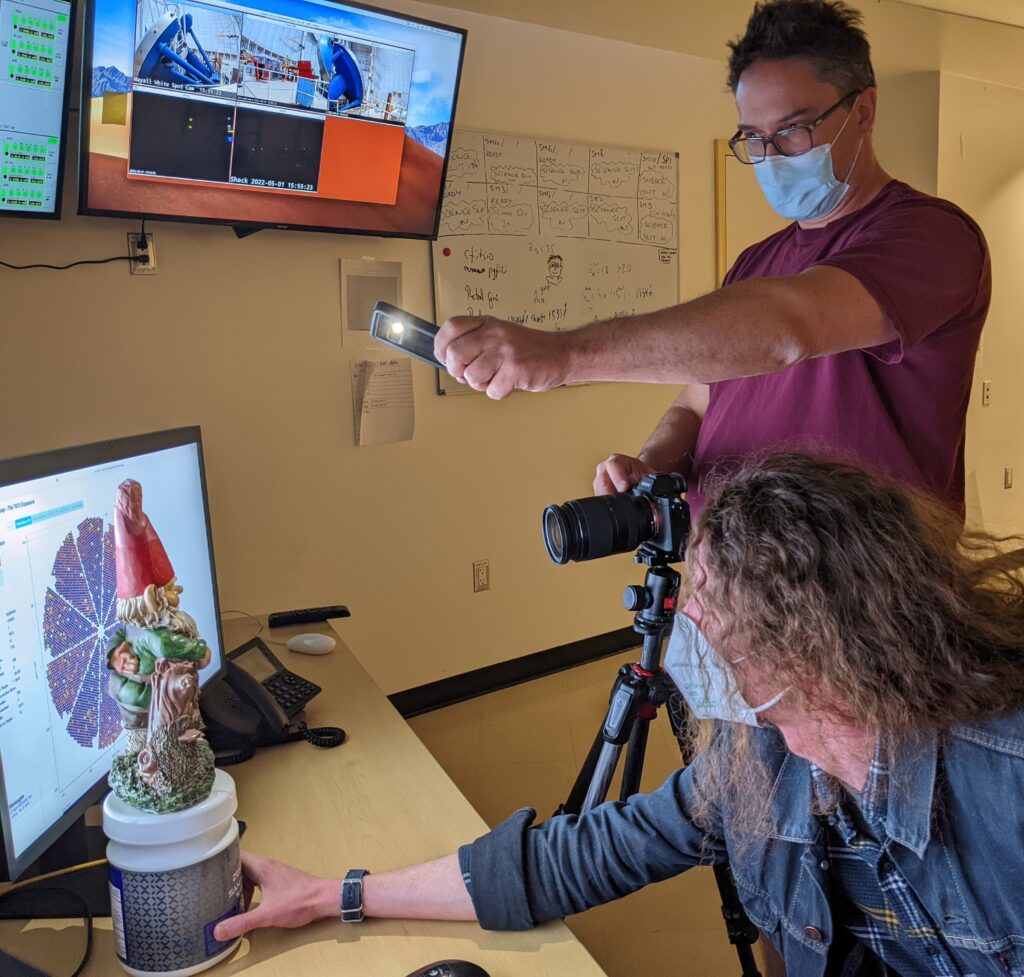
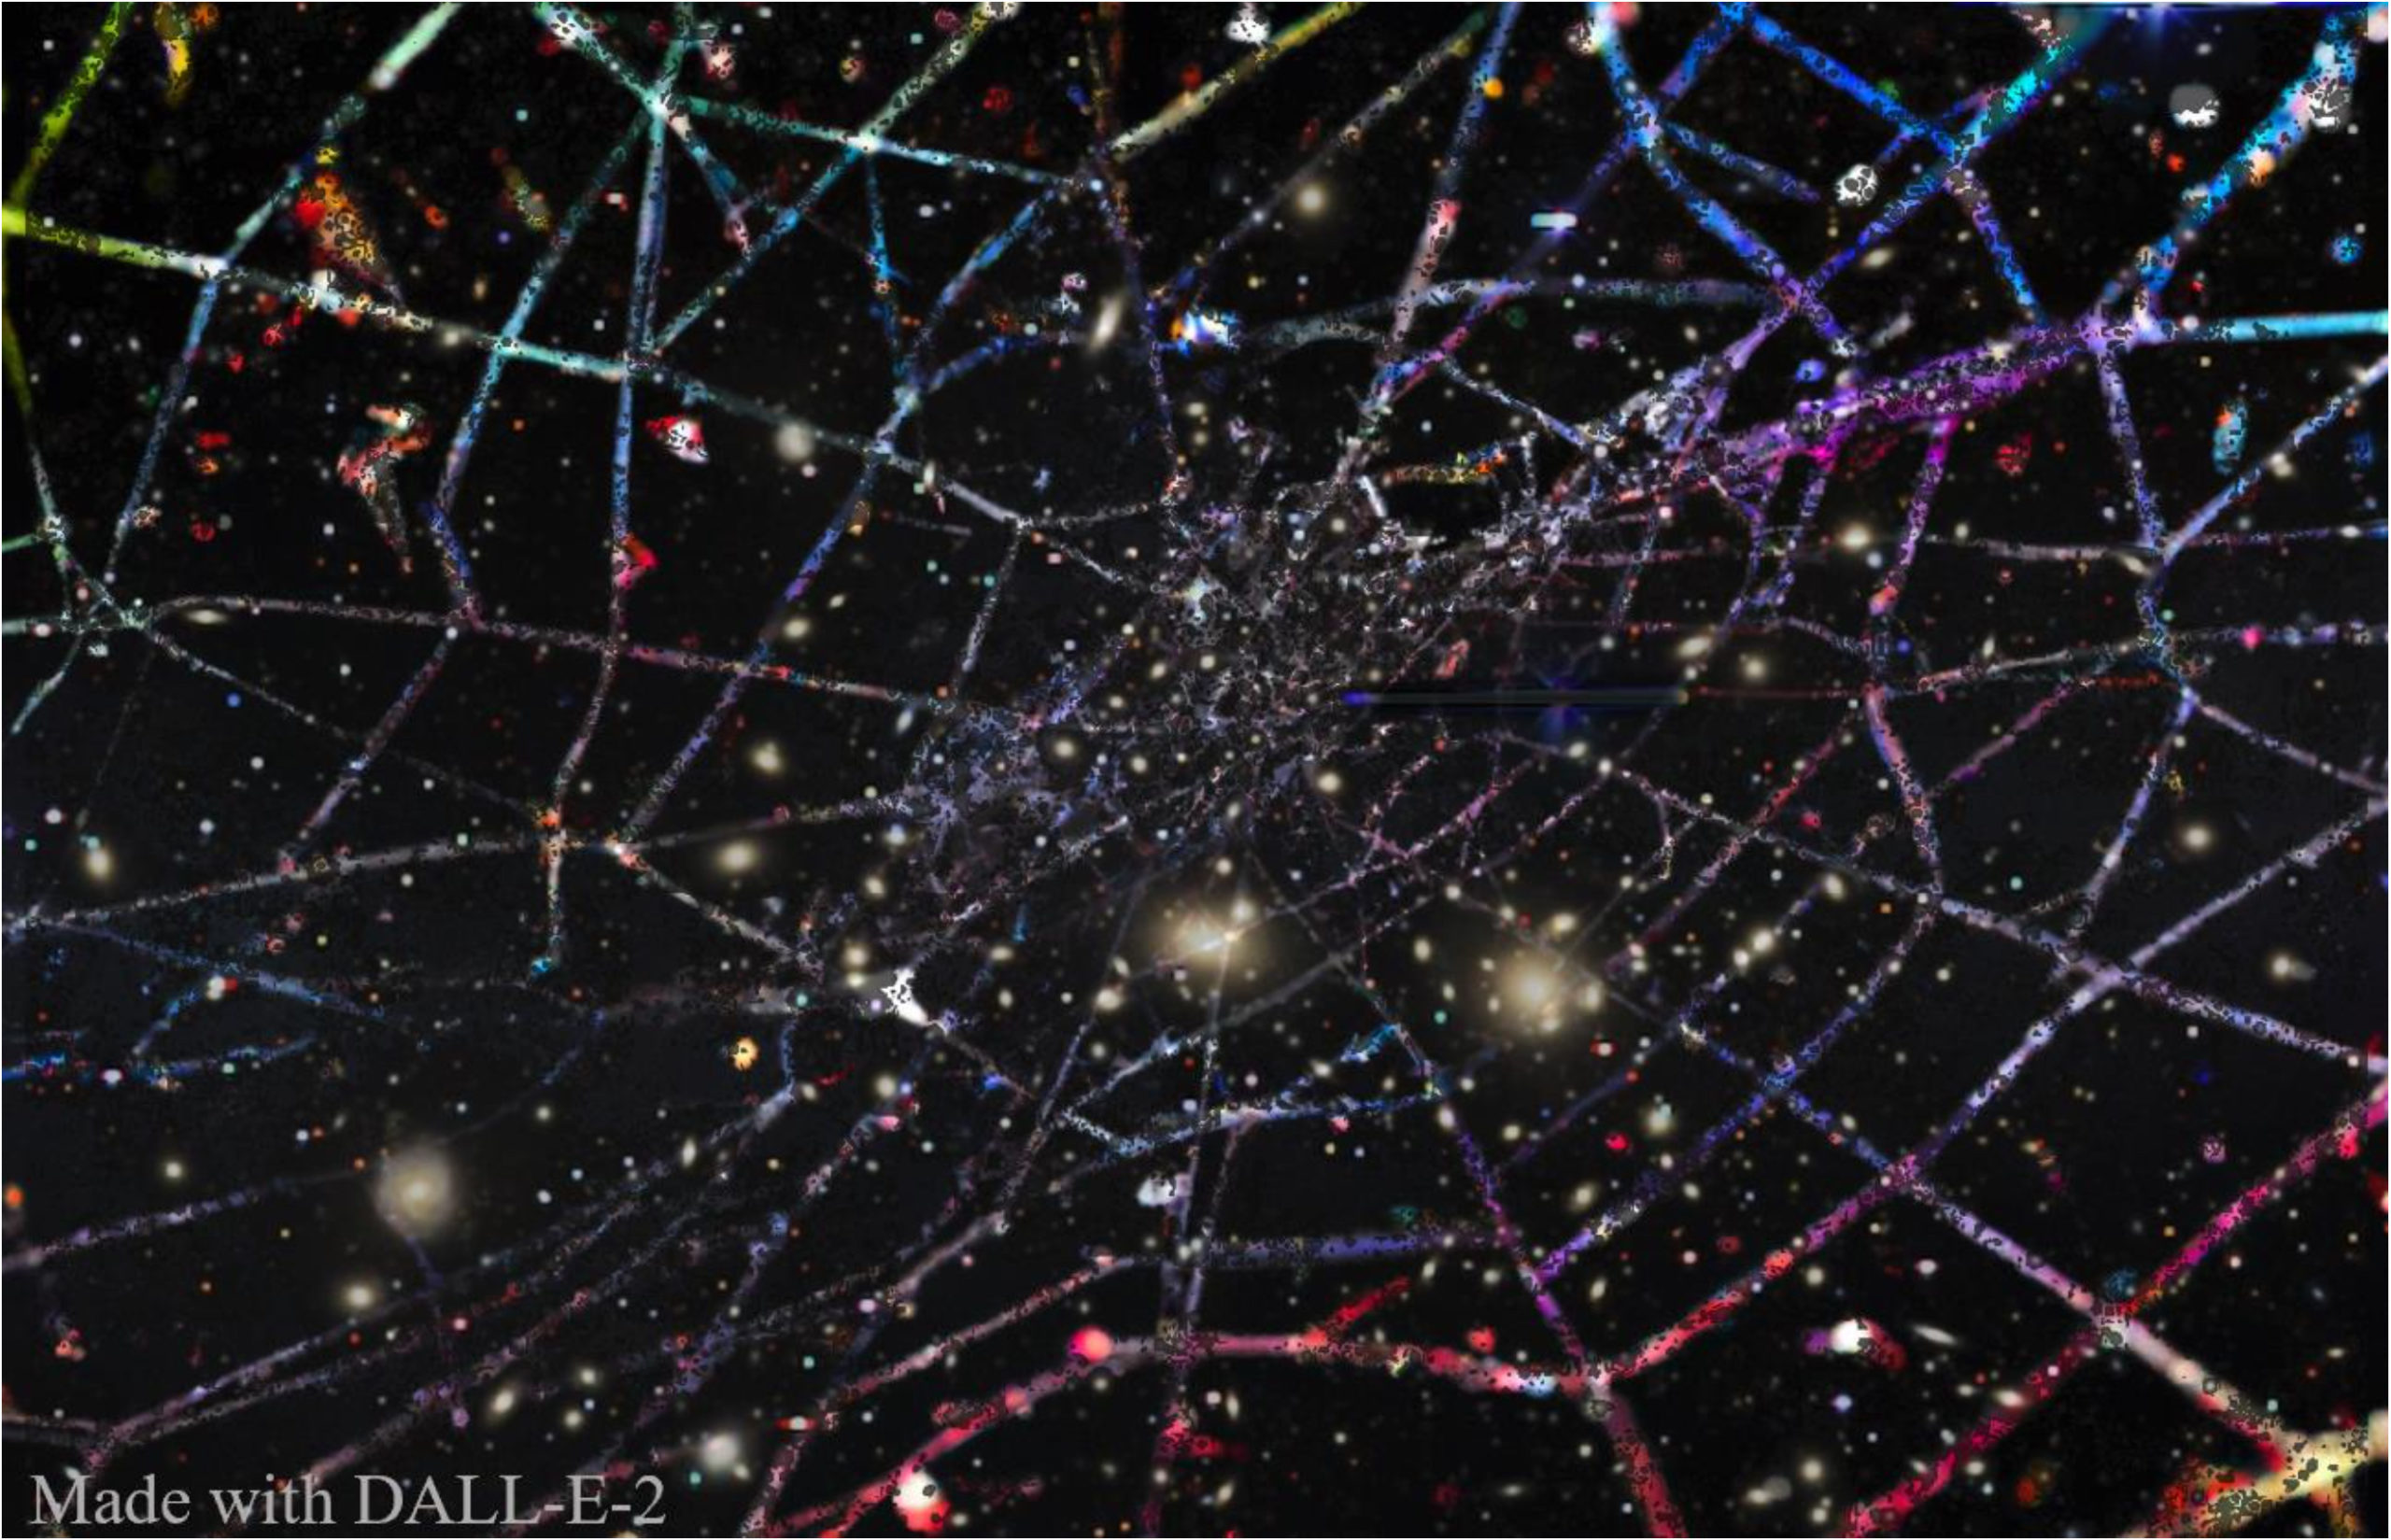


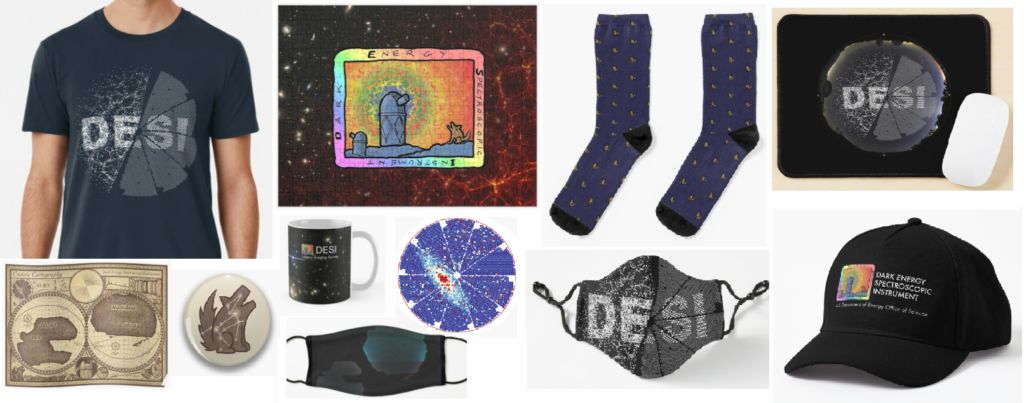
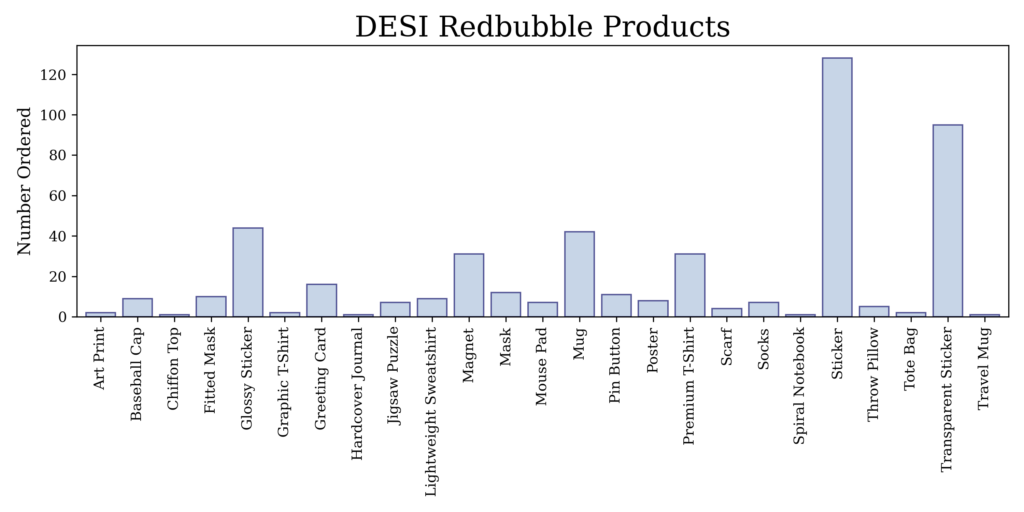
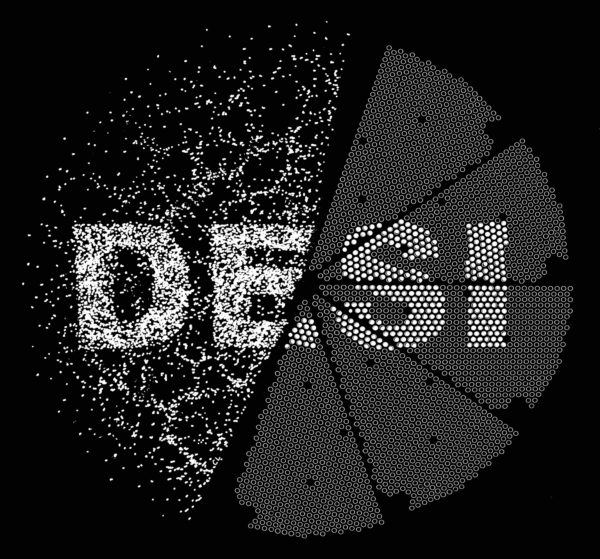 In honor of the opening of our online shop, I made a special DESI-gn that highlights both the science and instrumentation parts of our collaboration. “Dark Energy” is represented by a map of large-scale structure, and “Spectroscopic Instrument” is represented by our focal plane and its 5,000 robotic positioners.